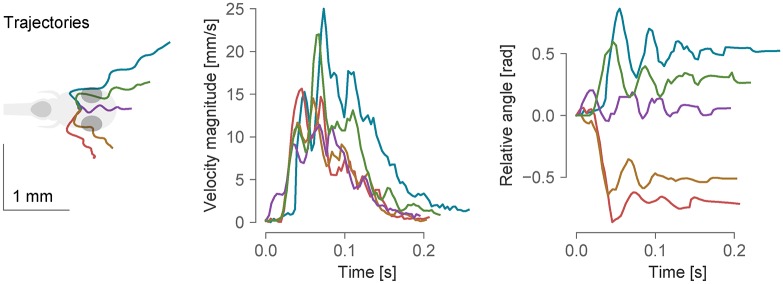
Fig 5. Example bouts tracked from freely-swimming fish.
From left to right: trajectories of bouts in different directions, the velocity magnitude and the total angle change during the course of the bouts. In the left-most panel, all trajectories were realigned such that the initial position and orientation of the fish were the same. The data was sampled at 300 Hz.

