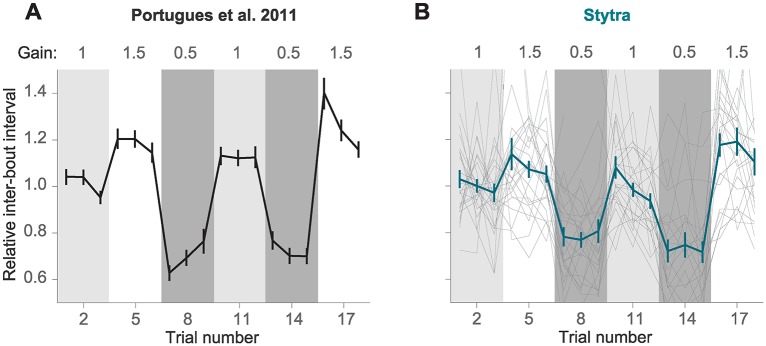
Fig 10. Visual feedback changes inter-bout interval in a head-restrained optomotor assay.
Replication within Stytra of results published in [13]. A) Changing the gain that is used to convert the fish’s swimming vigor to relative velocity with respect to the grating affects the inter-bout interval. The line represents the average normalized inter-bout time, and bars represent standard error of the mean from n = 28 larvae (adapted from [13]). B) Replication in Stytra of the same experimental protocol (n = 24 larvae). Individual fish traces are shown in gray.

