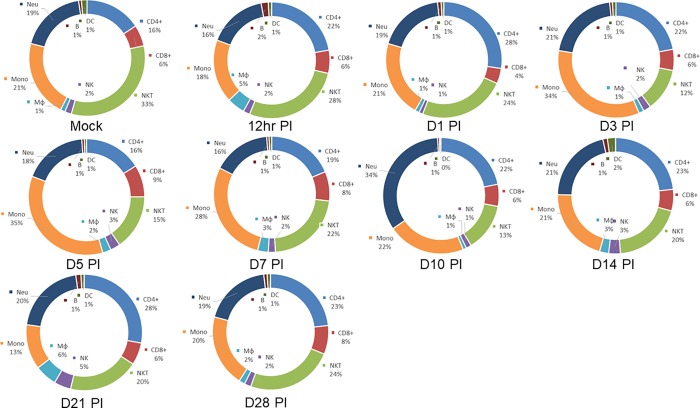
Fig 4. Pie charts showing the changes in relative percentages of immune cell subtypes in the cornea of infected mice.
Data described in Fig 3 above were used to measure the relative percentage of CD4+, CD8+, NKT, NK, Mφ (macrophages), Mono (monocytes) including M1 macrophages, Neu (neutrophils), B (B cells) and DC.

