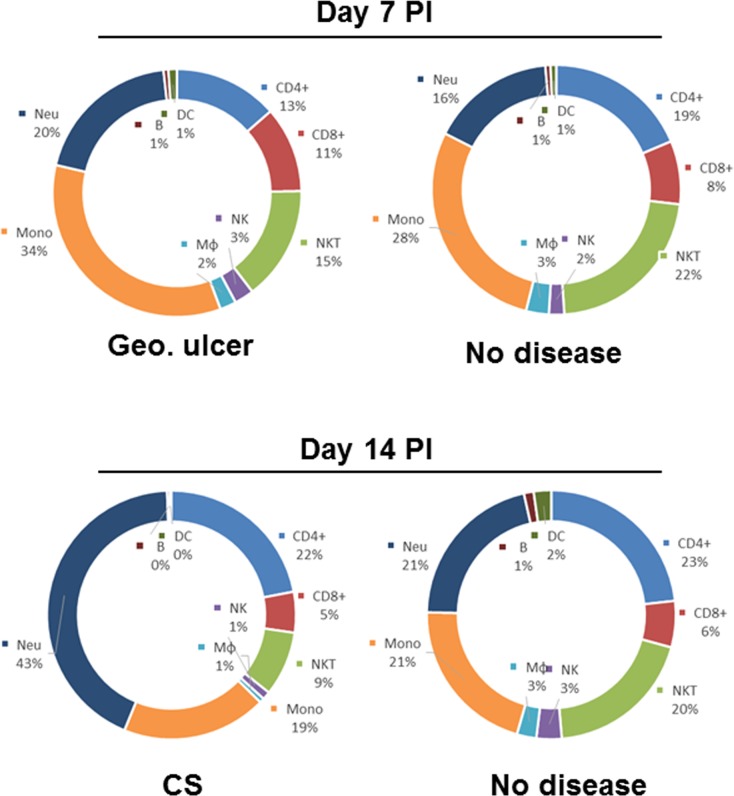
Fig 6. Pie charts comparing relative percentages of major immune cell subtypes in the corneas of infected mice between mice having geographical ulcer (GU), corneal scarring (CS) or no symptoms (NONE).
Data described in Fig 5 above were used to measure the relative percentage of CD4+, CD8+, NKT, NK, Mφ (macrophages), Mono (monocytes) including M1 macrophages, Neu (neutrophils), B (B cells) and DC.

