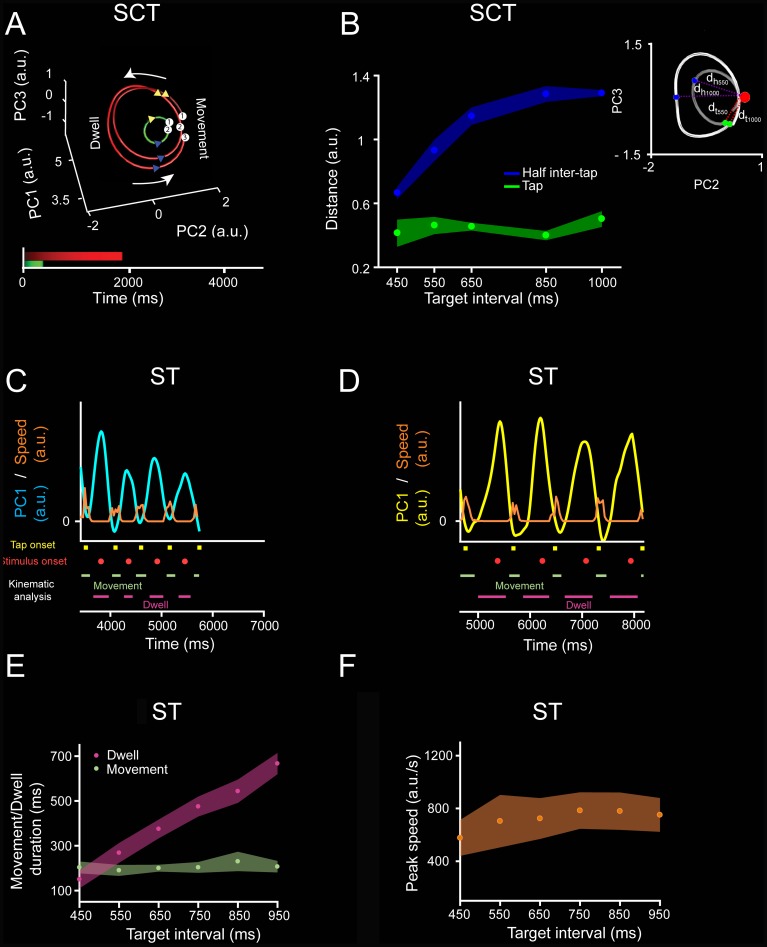
Fig 5. Neural trajectories do not follow the tapping kinematics.
A. Diagram of the rotational trajectory of the SCT neural activity during three inter-tap intervals: one 450-ms interval (green) and two 1,000-ms intervals (red). Each tap is numbered and projected in the trajectory as a white circle. A blue triangle marks the beginning, whereas a yellow triangle marks the end of the movement time. The monkeys produced phasic stereotypic movements whilst timing the dwell between taps during SCT [37]. B. Euclidean distance (dt, see inset) between an anchor point (red) and the position of each tap (green, mean ± SD, slope = 0.00007, R2 = 0.0633, p = 0.225), or half of the inter-tap interval position on the neural trajectories (blue, mean ± SD, slope = −0.001, R2 = 0.801, p < 0.0001) across target intervals for SC. A two-way ANOVA detected significant main effects on position (F(1, 40) = 1855.72, p < 0.0001), target interval (F(4, 40) = 77, p < 0.0001) and their interaction (F(4, 40) = 63.68, p < 0.0001). Tukey HSD post hoc test showed that the distances of the anchor point to tap and half inter-tap positions were significantly different (p < 0.05). In contrast, the anchor to tap distances across target intervals were not statistically different. Inset: scheme of the distance calculation; red sphere marks the anchor point and two-sample inter-tap trajectories for 550 ms (dark gray) and 1,000 ms (light gray) are shown. The green sphere marks the tap position and the blue sphere marks the half inter-tap position. Thus, the neural trajectories converge on an attractor around the tap time, to later diverge at half the inter-tap interval. Note that these results suggest the existence of tangent circular trajectories that converge in an intersection zone close to the tapping moment, although their amplitude changed as a function of interval. C. Speed of the tapping movement (orange trace) from the second to the sixth tap of ST, and the PC1 projected neural information (cyan) for 26 simultaneously recorded neurons during a trial with a target interval of 550 ms. Taps were represented as yellow squares and stimuli as red circles. Movement and dwell times are depicted in green and magenta, respectively. D. Similar to (C) during an 850-ms target interval (PC1 projected neural information as a yellow trace). E. Mean ± SD of the duration of the movement (green) and the dwell between movements (magenta) across target intervals, computed from the speed profile of the tapping movements. A two-way ANOVA showed significant main effects on kinematic state (movement/dwell duration, F(1, 228) = 1,850.61, p < 0.0001), target interval (F(5, 228) = 272.72, p < 0.0001), and their interaction (F(5, 228) = 236.18, p < 0.0001). Tukey HSD post hoc test showed that dwell durations across intervals were significantly different (p < 0.05). Therefore, the monkey modulated the dwell duration to successfully temporalize her behavior, while the down-push-up sequence of the tapping movement was phasic and stereotypic across target intervals. F. Mean ± SD of the peak speed during the tapping movement as a function of the target interval during ST (ANOVA main effect interval, F(5, 114) = 5.13, p < 0.001). The Tukey HSD post hoc test showed that only the peak speed of the 450-ms target interval trials were significantly different from the 650-, 750-, 850-, and 950-ms trials (p < 0.05). Underlying data are available in https://doid.gin.g-node.org/d315b3db0cee15869b3d9ed164f88cfa/. a.u., arbitrary unit; dh, Euclidean distance of the anchor point to the half inter-tap position; dt, Euclidean distance from the anchor point to the tap position; HSD, honestly significant difference; PC, principal component; SCT, synchronization-continuation task; ST, synchronization task.

