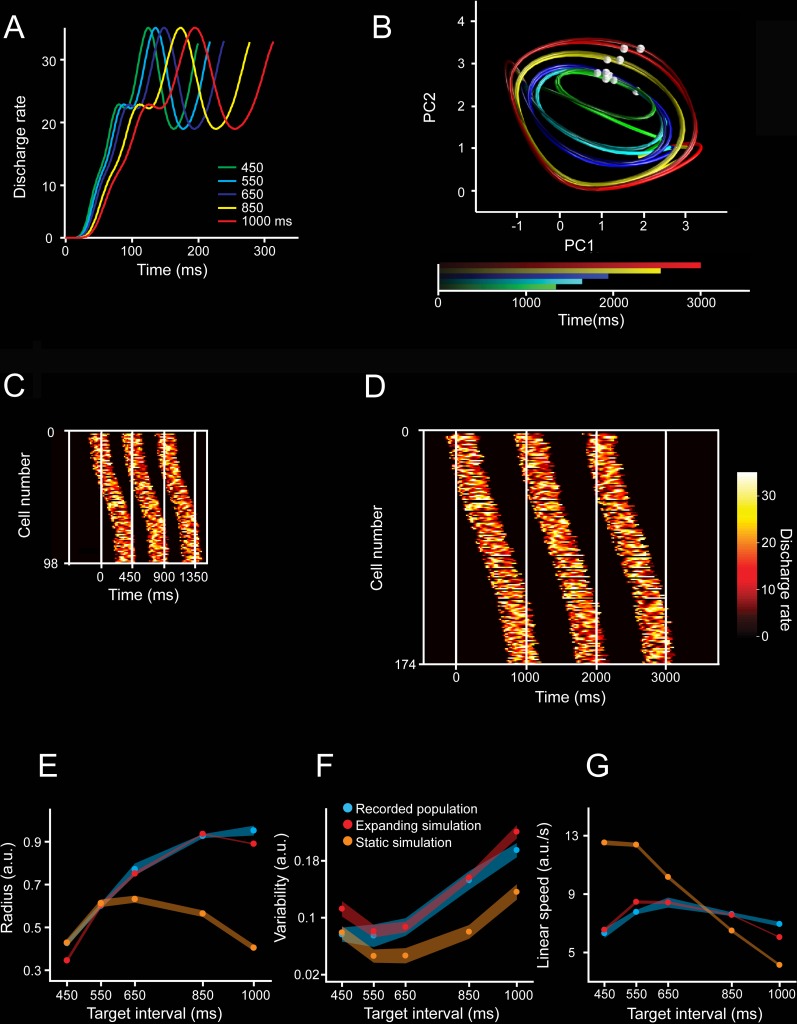
Fig 10. Simulations of moving bumps and neural trajectories.
A. Activity profile of one simulated neuron during its activation period is scaled for the five simulated durations. B. Neural trajectories generated from the population activity of moving bumps simulations. The number of neurons and activation periods varied across intervals (see Materials and methods). The simulated interval is color coded. Second and third simulated taps are marked as white spheres on each trajectory. C,D. Activation profiles of neurons for three consecutive simulated intervals with durations of 450 ms (C) and 1,000 ms (D). The white vertical lines correspond to the tap events defining the intervals. The activation profiles follow a Gaussian shape of cell recruitment, with slow activation rates at the tails (close to each tap). The number of neurons and the duration of the activation periods increased as a function of simulated interval. E,F,G. Radii (E), variability (F), and linear speed (G) of the neural trajectories generated from simulations. Data from the simulated neural activity with growing numbers of neurons and activation periods (expanding simulation: red), constant duration of activation periods and constant number of neurons (static simulation: orange), and from the actual recorded population during SCT (blue) across target intervals. Note that a constant was added to both simulation data in graphs. (E) Radii for simulation with expanding parameters (red, mean ± SD, slope = 0.0009, R2 = 0.811, p < 0.0001), simulation with static parameters (orange, mean ± SD, nonsignificant linear regression, slope = −0.0001, R2 = 0.811, p = 0.214), and actual neural activity (blue, mean ± SD, slope = 0.0009, R2 = 0.897, p < 0.0001). The slopes of the radius, variability, and linear speed were not statistically different between the simulations with expanding parameters and the actual neuronal trajectories (radius slope t test = 0.15, p = 0.878; variability slope t test = 0.25, p = 0.803; linear speed slope t test = 1.8, p = 0.077). However, the slopes between the simulations with constant parameters and neuronal trajectories showed statistically significant differences (radius slope t test = 9.13, p < 0.0001; variability slope t test = 3.73, p < 0.001; linear speed slope t test = 17.71, p < 0.0001). Underlying data are available in https://doid.gin.g-node.org/d315b3db0cee15869b3d9ed164f88cfa/. a.u., arbitrary unit; PC, principal component; SCT, synchronization-continuation task.

