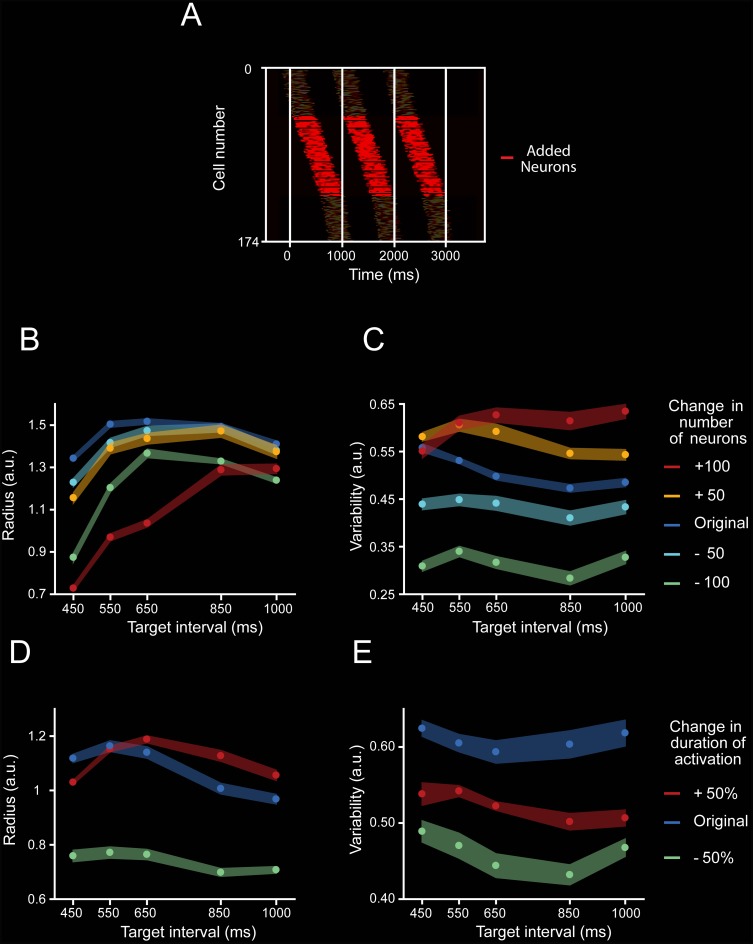
Fig 11. Moving bump simulation parameters.
A. Temporal positions of the activation periods of the neurons that were included to the simulation of the 1,000-ms target interval trial (red), in addition to the position of the activation periods of neurons that also participated in the 450-ms simulation (shaded). B,C. Radius (B) and variability (C) of PCA trajectories generated from moving bump simulations when the number of neurons was modified by a constant number (−100, green; −50, cyan; +50, yellow; and +100, red) from the original number of neurons (208 neurons for 450-ms target interval, 220 neurons for 550-ms target interval, 230 neurons for 650-ms target interval, 270 neurons for 850-ms target interval, and 282 neurons for 1,000-ms target interval; blue) while the activation period was kept constant at 257 ms across target intervals. A two-way ANOVA on the radius showed significant main effects for number of neurons (F(4, 100) = 10,544.2, p < 0.0001), target interval (F(4, 100) = 4,013.12, p < 0.0001), and their interaction (F(16, 100) = 25.8, p < 0.0001). Tukey HSD post hoc test showed significant differences for the radii of all simulations with different numbers of neurons and for all target intervals (p < 0.05). Additionally, A two-way ANOVA on the variability showed significant main effects for number of neurons (F(4, 100) = 2,421.8, p < 0.0001), target interval (F(4, 100) = 3,476.91, p < 0.0001), and their interaction (F(16, 100) = 22.53, p < 0.0001). Tukey HSD post hoc test showed significant differences for the variability of all simulations with different numbers of neurons (p < 0.05). D,E. Radius (D) and variability (E) of the trajectories generated from neural moving bumps in which the duration of the activation periods was reduced by 50% (short, green) or increased by 50% (long, red) of the original scaled duration (197 ms for 450-ms target interval, 205 ms for 550-ms target interval, 213 ms for 650-ms target interval, 233 ms for 850-ms target interval, and 257 ms for 1,000-ms target interval; blue) while the number of neurons was kept constant at 130 across target intervals. A two-way ANOVA on the variability showed significant main effects for activation duration (F(2, 60) = 3,081.54, p < 0.0001), target interval (F(4, 60) = 2,801.16, p < 0.0001), and their interaction (F(8, 60) = 211.34, p < 0.0001). Tukey HSD post hoc test showed significant differences for all simulations with different activation durations (p < 0.05). In addition, a two-way ANOVA on the variability showed significant main effects for activation duration (F(2, 60) = 1,227.53, p < 0.0001), target interval (F(4, 60) = 257.49, p < 0.0001), and their interaction (F(8, 60) = 24.87, p < 0.0001). Tukey HSD post hoc test showed significant differences for all simulations with different activation durations (p < 0.05). Thus, the number of neurons and the activation duration within moving bumps produce large changes in the radius and variability of the simulated neural trajectories. a.u., arbitrary unit; HSD, honestly significant difference; PCA, principal component analysis.

