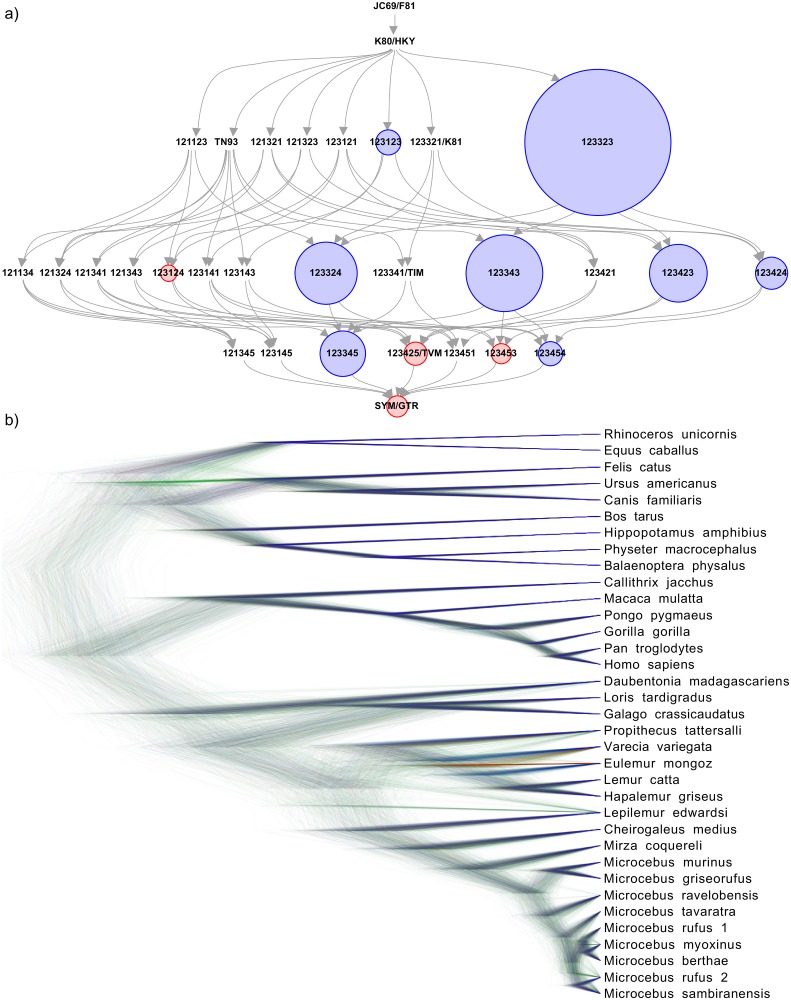
Fig 2. bModelTest analysis for 36 mammalian species [50].
a) Posterior distribution of substitution models. Each circle represents a substitution model indicated by a six digit number corresponding to the six rates of reversible substitution models. In alphabetical order, these are A→C, A→G, A→T, C→G, C→T, and G→T, which can be shared in groups. The six digit numbers indicate these groupings, for example 121121 indicates the HKY model, which has shared rates for transitions and shared rates for transversions. Here, only models are considered that are reversible and do not share transition and transversion rates (with the exception of the JC69 and F81 models). Other substitution model sets are available. Links between substitution models indicate possible jumps during the MCMC chain from simpler (tail of arrow) to more complex (head of arrow) models and back. There is no single preferred substitution model for this data, as the posterior probability is spread over a number of alternative substitution models. Blue circles indicate the eight models contained in the 95% credible set, models with red circles are outside of this set, and models without circles have negligible support. b) Posterior tree distribution resulting from the bModelTest analysis.

