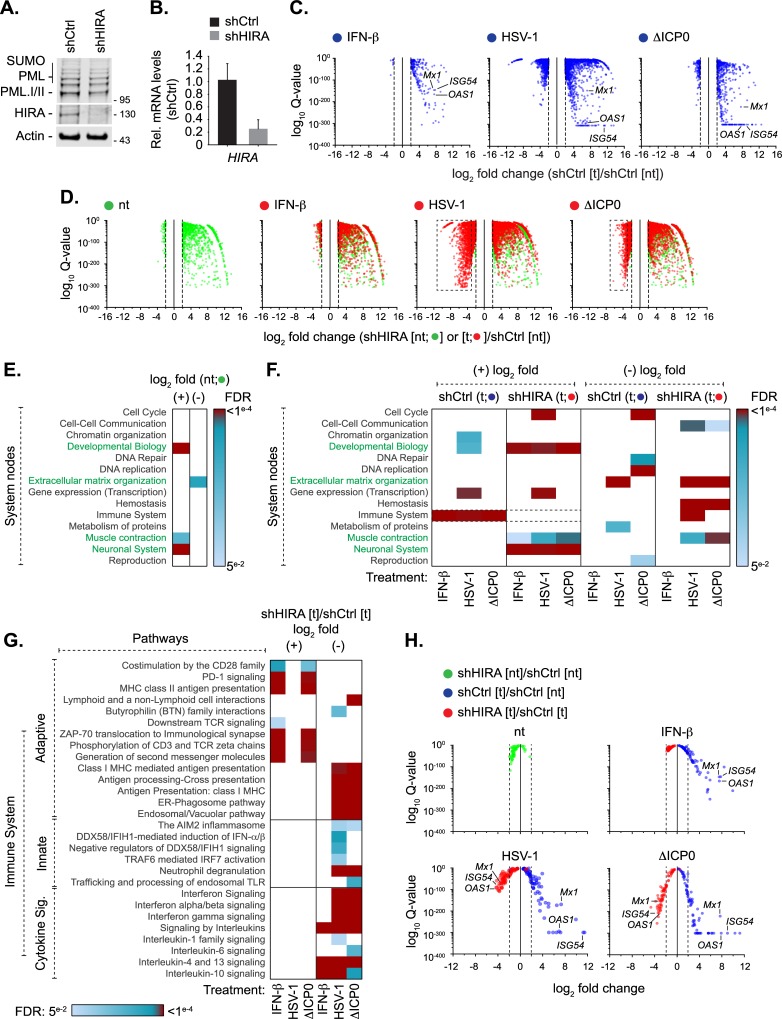
Fig 5. HIRA mediates the induction of host innate immune defences in response to HSV-1 infection.
HFt cells were stably transduced to express shRNAs targeting HIRA (shHIRA) or non-targeting control (shCtrl). Cells were either mock treated (no treatment, [nt]) or stimulated with IFN-β (100 IU/ml) or infected with HSV-1 WT or ΔICP0 (MOI 1 PFU/cell) for 17 h (treated, [t]) prior to RNA extraction for RNA-seq analysis. (A) Western blot analysis of the expression levels of PML or HIRA in whole cell lysates derived from shCtrl or shHIRA cells. Actin is shown as a loading control. Molecular mass markers are shown. (B) qRT-PCR quantitation of HIRA mRNA levels in shCtrl or shHIRA cells. n = 3, means and SD shown and expressed relative to shCtrl cells. (C) Scatter plots showing high confidence changes in cellular transcript abundance in shCtrl cells treated with IFN-β or infected with HSV-1 WT or ΔICP0 (as indicated; shCtrl [t]) expressed relative to their abundance in non-treated shCtrl cells (shCtrl [nt]; FDR Q-values ≤ 0.0001, ≥ log2 fold change, vertical dotted lines). (D) Scatter plots showing high confidence changes in cellular transcript abundance in shHIRA cells either not treated (green circles, [nt]) or treated with IFN-β or infected with HSV-1 WT or ΔICP0 (as indicated; red circles [t]) expressed relative to their levels in non-treated shCtrl cells (shCtrl [nt]; FDR Q-value ≤ 0.0001, ≥ log2 fold change). Dotted boxes highlight clusters of significantly downregulated genes in HIRA depleted cells infected with WT or ΔICP0 HSV-1. (E) Reactome (https://reactome.org/) pathway analysis of high confidence transcriptome changes (described in D) identified between shHIRA and shCtrl cells (green circles in D). Heat map shows reactome FDR (corrected over-representation P value) for pathway nodes enriched in high-confidence mapped entities (Listed in S2 Table). FDR < 0.05 to ≤ 0.0001 (light blue to dark red, significant change); FDR > 0.05 (white, no significant change). Pathway nodes enriched in HIRA depleted cells are highlighted in green text. (F) Heat map (as above) showing pathway analysis for enriched pathway nodes identified in shCtrl (blue circles in C; S1 Table) or shHIRA (red circles in D; S3 Table) cells treated with IFN-β or infected with HSV-1 WT or ΔICP0 (as indicated) relative to non-treated control cells (shCtrl [nt]). (G) Heat map (as above) showing an expanded immune system node highlighting enriched pathways identified in shHIRA cells treated with IFN-β or infected with HSV-1 WT or ΔICP0 (as indicated; shHIRA [t]) relative to similarly treated or infected shCtrl cells (shCtrl [t]; S4 and S5 Tables). (H) Scatter plots showing relative transcript levels (FDR Q-values < 0.05) of core human ISGs [84] in untreated (nt) or treated (t) shCtrl or shHIRA cells (as indicated; S6 Table). Vertical dotted lines highlight log2 fold change cut off for reference. Position of selected ISGs (Mx1, ISG54, and OAS1) highlighted throughout for reference.

