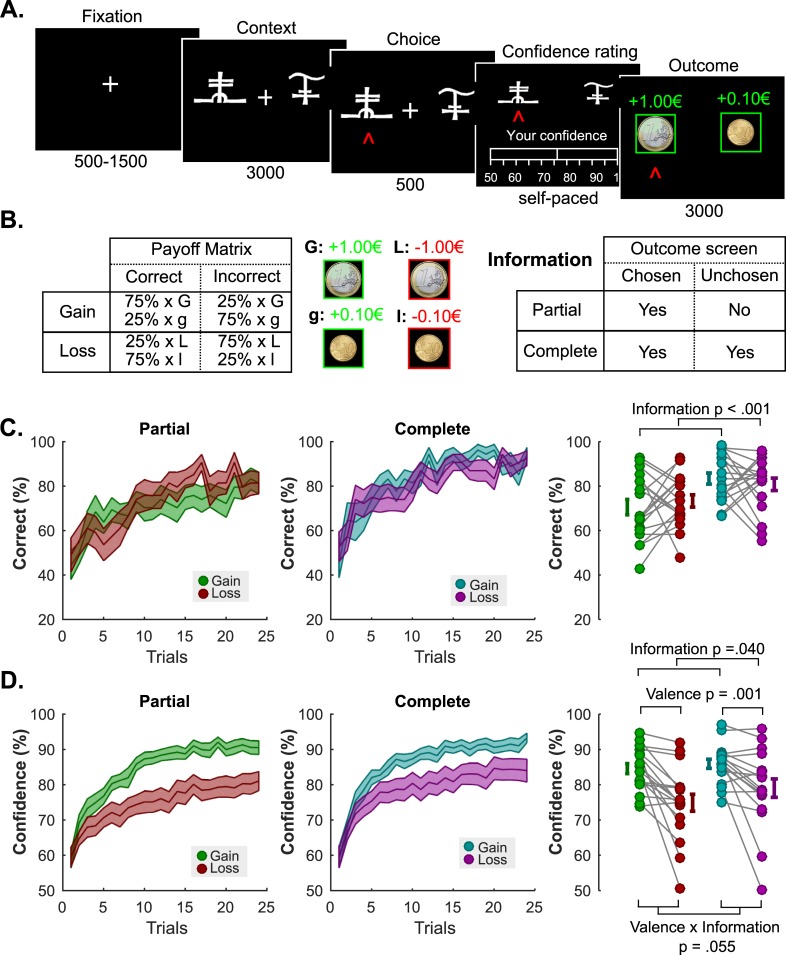
Fig 2.
Experiment 2 Task Schematic, Learning and Confidence Results (A) Behavioral task. Successive screens displayed in one trial are shown from left to right with durations in ms. After a fixation cross, participants viewed a couple of abstract symbols displayed on both sides of a computer screen, and had to choose between them. They were thereafter asked to report their confidence in their choice on a numerical scale (graded from 50 to 100%). Finally, the outcome associated with the chosen symbol was revealed. (B) Task design and contingencies. (C) Performance. Trial by trial percentage of correct responses in the partial (left) and the complete (middle) information conditions. Filled colored areas represent mean ± sem; Right: Individual averaged performances in the different conditions. Connected dots represent individual data points in the within-subject design. The error bar displayed on the side of the scatter plots indicate the sample mean ± sem. (D) Confidence. Trial by trial confidence ratings in the partial (left) and the complete (middle) information conditions. Filled colored areas represent mean ± sem; Right: Individual averaged performances in the different conditions. Connected dots represent individual data points in the within-subject design. The error bar displayed on the side of the scatter plots indicate the sample mean ± sem.

