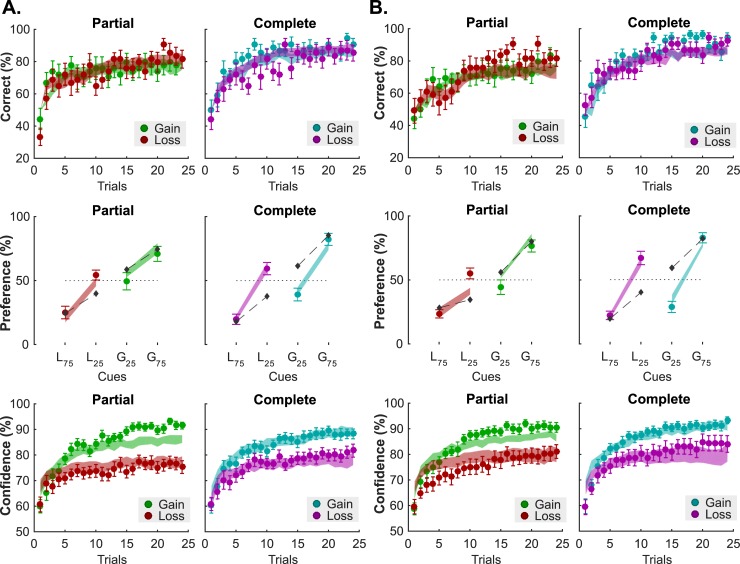
Fig 4. Modelling results: Fits.
Behavioral results and model fits in Experiments 1(A) and 2 (B). Top: Learning performance (i.e. percent correct). Middle: Choice rate in the transfer test. Symbols are ranked by expected value (L75: symbol associated with 75% probability of losing 1€; L25: symbol associated with 25% probability of losing 1€; G25: symbol associated with 25% probability of winning 1€; G75: symbol associated with 75% probability of winning 1€;) Bottom: Confidence ratings. In all panels, colored dots and error bars represent the actual data (mean ± sem), and filled areas represent the model fits (mean ± sem). Model fits were obtained with the RELATIVE reinforcement-learning model for the learning performance (top) and the choice rate in the transfer test (middle), and with the FULL glme for the confidence ratings (bottom). Dark grey diamonds in the Preference panels (middle) indicate the fit from the ABSOLUTE model.

