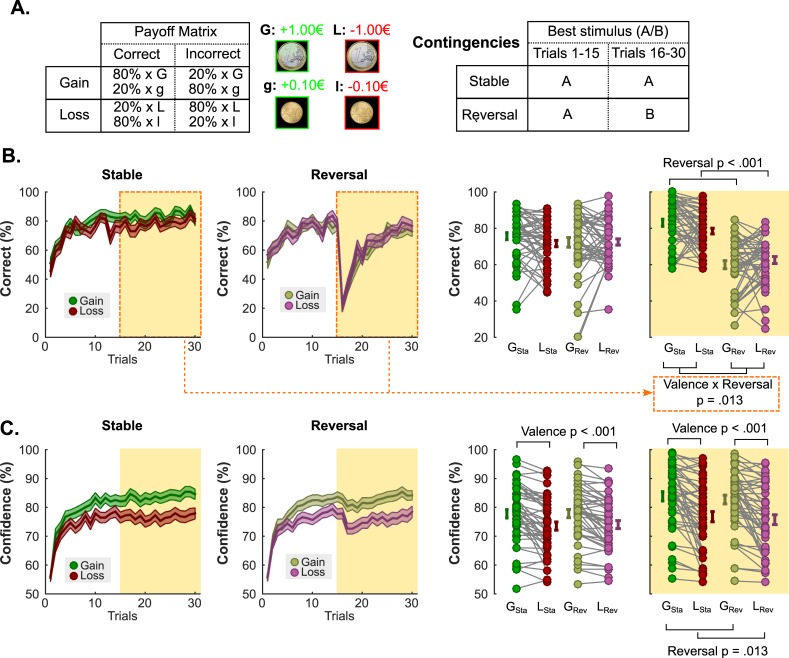
Fig 7.
Experiment 3 task schematic, reversal learning and confidence results. (A) Task design and contingencies. (B) Performance. Trial by trial percentage of correct responses in the partial (left) and the complete (middle-left) information conditions. Filled colored areas represent mean ± sem; Middle-right and right: Individual averaged performances in the different conditions, before (middle-right) and after (right) the reversal. The orange shaded area highlights the post-reversal behavior. Connected dots represent individual data points in the within-subject design. The error bar displayed on the side of the scatter plots indicate the sample mean ± sem. (C) Confidence. Trial by trial confidence ratings in the partial (left) and the complete (middle-left) information conditions. Filled colored areas represent mean ± sem; Middle-right and right: Individual averaged performances in the different conditions, before (middle-right) and after (right) the reversal. The orange shaded area highlights the post-reversal behavior. Connected dots represent individual data points in the within-subject design. The error bar displayed on the side of the scatter plots indicate the sample mean ± sem. GSta: Gain Stable; LSta: Loss Stable; GRev: gain reversal; LRev: Loss Reversal.

