. 2018 Sep 28;10:ecurrents.outbreaks.7a6c64436a3085ebba37e5329ba169e6. [Version 1] doi: 10.1371/currents.outbreaks.7a6c64436a3085ebba37e5329ba169e6

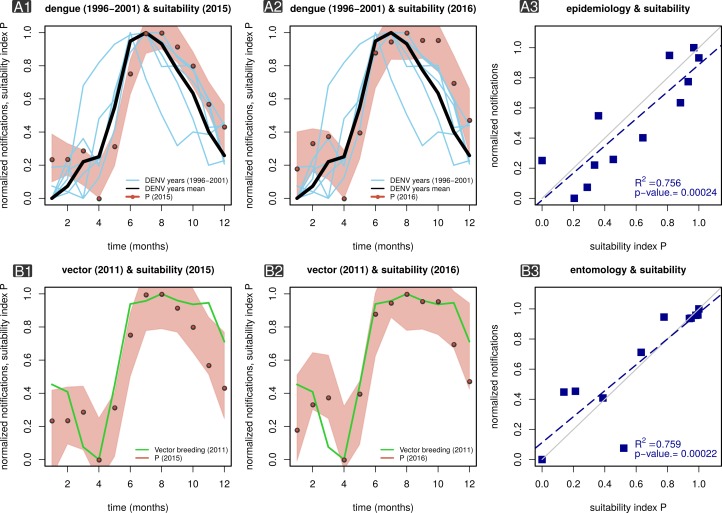
MBV suitability index P and ento-epidemiological time series in Myanmar.

Panel A1 presents the mean estimated index P across Myanmar for 2015 (red dots, locally weighted smoothing bounds within red area) superimposed on monthly case counts of DENV for several transmission seasons (1996-2001, blue lines) in Myanmar. The black line is the mean DENV case counts 1996-2001. Panel A2 is the same as B1 but with P estimated for 2016. Panel A3 is a linear regression of mean DENV case counts (1996-2001) versus the mean index P (2015-2016) as displayed in panels A1-2. Panel B1 presents the mean estimated index P in Yangon for 2015 (red dots, locally weighted smoothing bounds within red area) superimposed on monthly number of major breeding containers in 2011 (green lines) for Yangon. Panel B2 is the same as B1 but with P estimated for 2016. Panel B3 is a linear regression of major breeding sites (2011) versus the mean index P (2015-2016) as displayed in panels B1-2.

Panel A1 presents the mean estimated index P across Myanmar for 2015 (red dots, locally weighted smoothing bounds within red area) superimposed on monthly case counts of DENV for several transmission seasons (1996-2001, blue lines) in Myanmar. The black line is the mean DENV case counts 1996-2001. Panel A2 is the same as B1 but with P estimated for 2016. Panel A3 is a linear regression of mean DENV case counts (1996-2001) versus the mean index P (2015-2016) as displayed in panels A1-2. Panel B1 presents the mean estimated index P in Yangon for 2015 (red dots, locally weighted smoothing bounds within red area) superimposed on monthly number of major breeding containers in 2011 (green lines) for Yangon. Panel B2 is the same as B1 but with P estimated for 2016. Panel B3 is a linear regression of major breeding sites (2011) versus the mean index P (2015-2016) as displayed in panels B1-2.