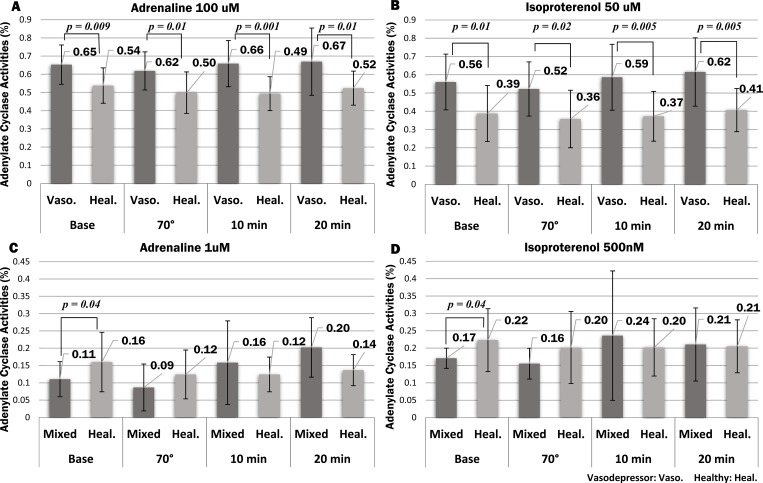
Fig 7. Analysis of AC activities in NMS subjects (VT, MT) and 22 healthy volunteers during the HUT test.
This figure shows the analyzed t-test (p < 0.05) among the VT (n = 11), MT (n = 6) of NMS patients and healthy volunteers (n = 12). AD at concentrations 100 μM and 1 μM, IP at 50 μM. Error bars show mean ± standard deviation (S5 Table and S6 Table). * Some patients were in poor condition around 10 minutes from the tilt table set to 70°at the HUT test. (A) AD concentrations (100 μM) (B) IP concentrations (50 μM) (C) AD concentrations (1μM) (D) IP concentrations (500 nM).

