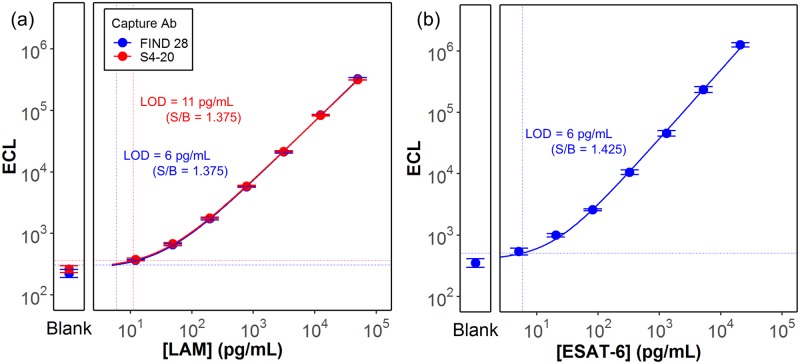
Fig 1. Calibration curves (ECL signal as a function of the concentration) for the (a) LAM and (b) ESAT-6 assays.
Each panel also provides the measured signal for a blank sample containing no analyte. Solid lines show the 4PL fit to the data. The horizontal and vertical dashed lines represent, respectively, the lowest detectable signals—based on the threshold signal to background (S/B) value as described in the text—and the limit of detections (LOD) calculated from the lowest detectable signal by back-fitting to the 4PL curve.

