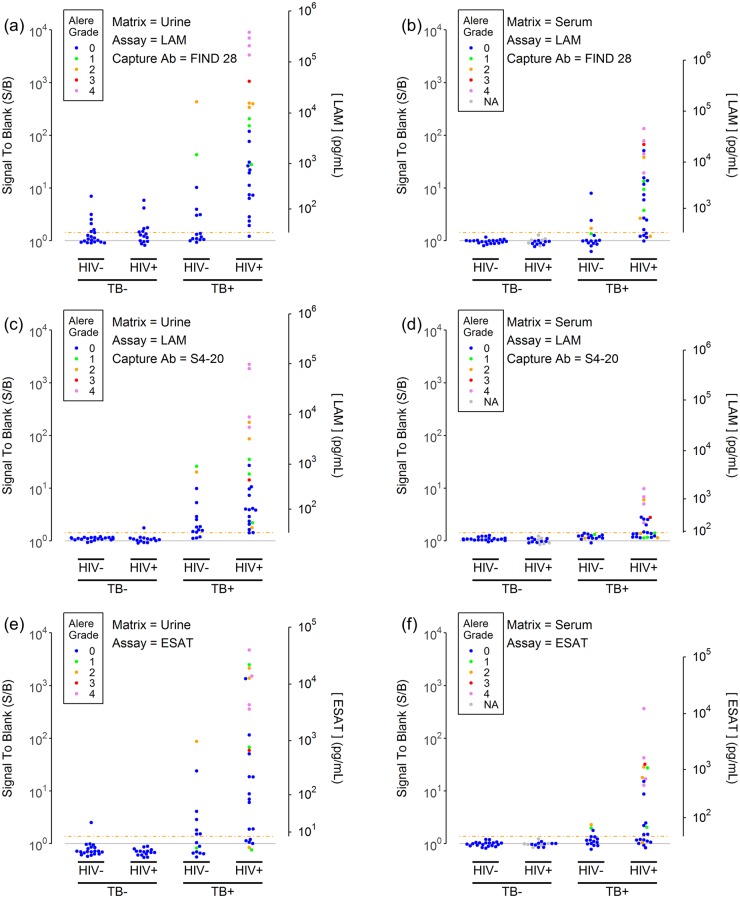
Fig 2. LAM and ESAT-6 concentrations in urine (left column) and serum samples (right column).
The plots show LAM (panels a-d) and ESAT-6 (panels e-f) assay signals (normalized to the blank signal) for a set of urine (panels a, c and e) and serum samples (panels b, d and f) as a function of the TB and HIV status of the donor. LAM assay results are provided for the two most sensitive anti-LAM capture antibodies: FIND 28 (panels a-b) and S4-20 (panels c-d). The gray horizontal shows the blank signal (S/B = 1). The dashed orange line shows the assay threshold (S/B = 1.375 for the LAM assays, S/B = 1.425 for the ESAT-6 assay) which is equal to the limit of detection (LOD). The second y axis provides estimated analyte concentrations for concentrations above the LOD. The points are colored by the Alere LF-LAM results for urine from the same subjects (0 = LF-LAM negative, 1 to 4 represents increasing LF-LAM test color intensity as determined by comparison to the Alere LF-LAM reference card).

