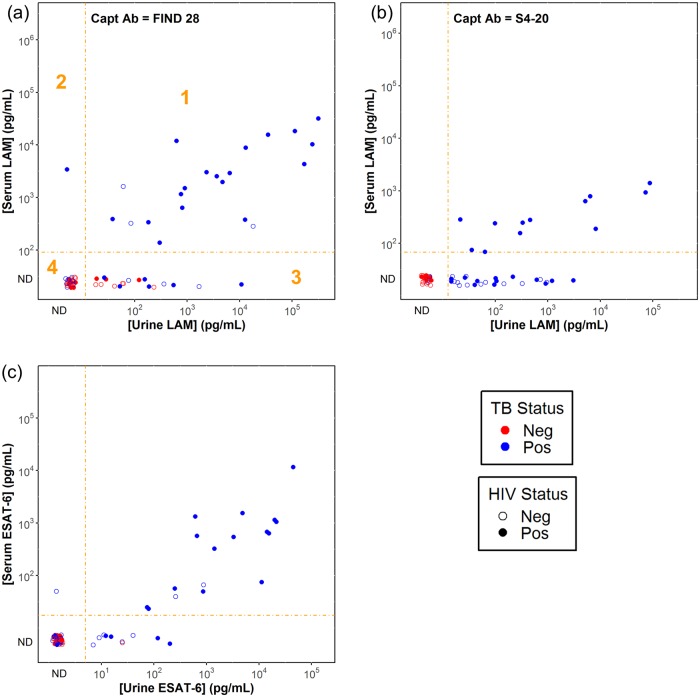
Fig 3. Correlation of LAM and ESAT-6 concentrations in urine and serum.
The plots show the results for LAM measurements using the FIND 28 (panel a) and S4-20 (panel b) capture antibodies, and the results for the ESAT-6 assay (panel c). Concentrations in serum are corrected for the additional 4-fold dilution of serum samples relative to urine samples. The dashed orange lines show the dilution-corrected detection limits for the assays. Data points with signals below the detection thresholds (categorized as “ND” or not detectable) are shown for completeness, but do not have assigned concentrations. As indicated with the orange numbering in panel a, the plots can be divided into four regions: (1) concentrations measurable in serum and urine; (2) concentrations only measurable in serum; (3) concentrations only measurable in urine and (4) concentrations not measurable in either matrix. Percentages of categorical agreement are shown in S4 Table. Data points are colored based on TB status and filled based on HIV status as indicated in the key.

