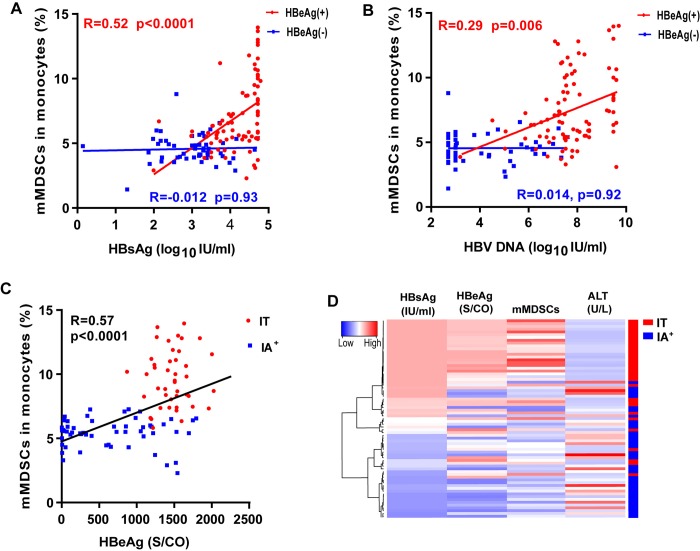
Fig 2. Correlation analysis between the frequency of circulating mMDSCs and clinical parameters.
The correlation between mMDSCs percentage in monocytes and the levels of HBsAg (A) or HBV DNA (B) from HBeAg (+) patients (red) and HBeAg (-) patients (blue) were analyzed by Spearman correlation. (C) Correlation analysis between the frequency of mMDSCs and HBeAg level in HBeAg (+) patients. (D) Unsupervised hierarchical clustering using Euclidean distance; dendrogram displaying similarity between clusters. Clinically assigned disease phase shown adjacent to plot (not used for analysis). Increasing color intensity (blue→ red) corresponds to increasing mMDSC frequency, serum HBsAg (IU/ml), HBeAg (S/CO), or ALT (U/l).

