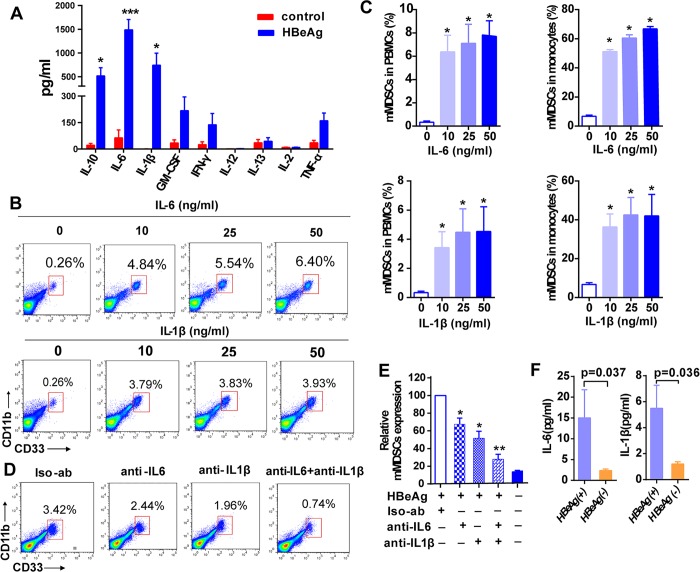
Fig 4. HBeAg promotes expansion of mMDSCs in an IL-6 and IL-1β dependent manner.
(A) PBMCs from healthy donors were cultured in the presence of HBeAg (0.5 μg/ml) for 5 days and the concentrations of cytokines in supernatant were measured. (B and C) PBMCs were treated with various concentrations of IL-6 or IL-1β for 5 days. The proportion of mMDSCs was analyzed by flow cytometry. Representative plots of mMDSCs frequency in PBMCs are shown. The histograms show the statistical analysis of mMDSCs frequency in PBMCs and in monocytes after cytokine stimulation (mean ± SEM, n = 3). (D and E) PBMCs from healthy donors were cultured with HBeAg (0.5μg/ml), and isotype control antibody, or anti-IL6, anti-IL1β or anti-IL6 in combination with anti-IL1β (15 μg/ml) were added to the cultures for 5 days, followed by flow cytometry analysis of mMDSCs. The representative dot plot is shown. Mean values (±SEM) are shown for three independent experiments. (F) The plasma concentrations of IL-6 and IL-1β in HBeAg (+) and HBeAg (-) patients were measured by ELISA, mean ± SEM values are shown for 42 HBeAg (+) patients and 33 HBeAg (-) patients. *p<0.05, **p<0.01, ***p<0.001.

