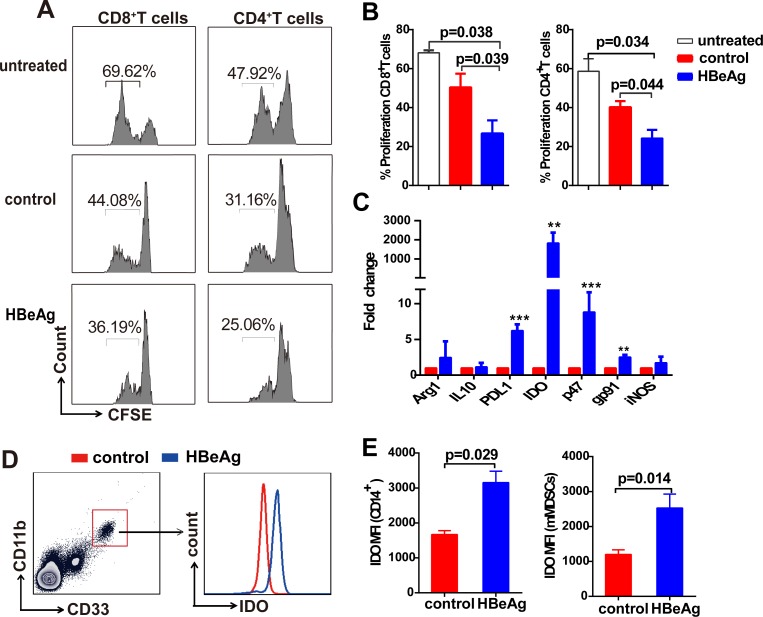
Fig 5. HBeAg-induced CD33+ cells suppress T-cell activation.
(A) PBMCs from healthy donors were untreated (control) or treated with rHBeAg (0.5 μg/ml) for 5 days. CD33+ cells were then isolated and incubated with autologous Pan T cells in the presence of human T-activator CD3/CD28 beads for 3 days (middle and bottom panels). Pan T cells alone stimulated by CD3/CD28 beads for 3 days served as untreated control (top panel). CD4+ and CD8+ T-cell proliferation was determined by CFSE dilution. The plots are representative results. (B) The graph shows the results expressed as the mean ± SEM of 5 independent experiments. (C) Monocytes from healthy donors were treated with HBeAg (0.5 μg/ml) for 5 days, untreated served as controls. MDSC-related molecules were detected by qPCR (mean ± SEM, n = 9). *p<0.05, **p<0.01, ***p<0.001. (D and E) The IDO expression in HBeAg-induced CD14+ cells and mMDSCs was analyzed by intracellular staining. A representative plot of IDO staining in HBeAg-induced mMDSCs is shown. The histograms show the MFI (median fluorescence intensity) of IDO in HBeAg-induced CD14+ cells and mMDSCs (mean ±SEM, n = 5).

