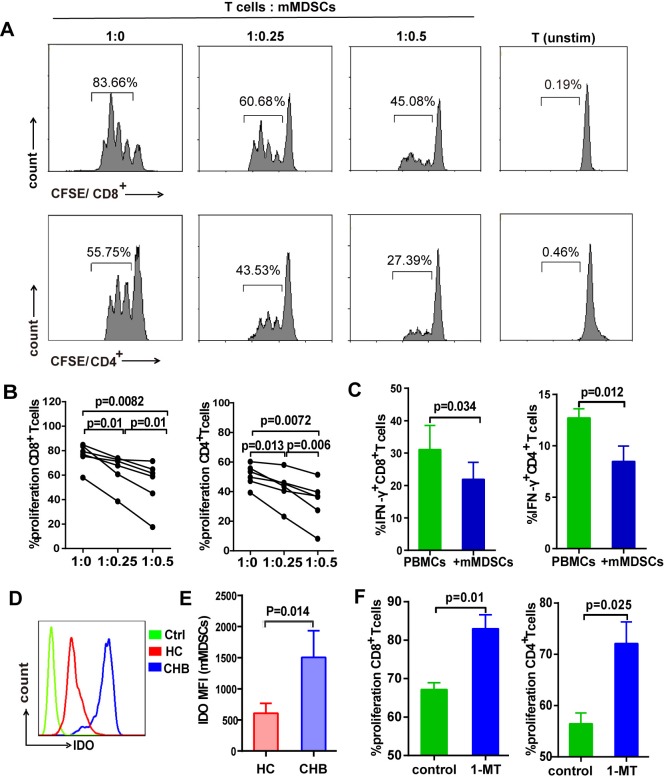
Fig 6. mMDSCs from HBeAg (+) patients suppresses T-cell response through IDO.
(A) Purified mMDSCs from HBeAg (+) donors were cultured with autologous T cells at different ratios as indicated. Pan T cells without CD3/CD28 activation serves as unstimulated control. CD8+ and CD4+ T-cell proliferation was evaluated by CFSE dilution. Representative plots are shown. (B) The histograms show results form 6 individual patients. (C) Purified mMDSCs were co-incubated with PBMCs at a ratio of 1:2 for 6 hours in the presence of PMA/ionomycin, IFN-γ was measured by intracellular cytokine staining (mean ± SEM, n = 4). (D and E) Representative plot of IDO expression in mMDSCs from HBeAg (+) patients (CHB, blue line), healthy donors (HC, red line), and isotype control (Ctrl, green line) determined by intracellular staining. Mean ± SEM values are shown for 13 HBeAg (+) patients and 9 healthy controls. (F) mMDSCs purified from HBeAg (+) donors were co-cultured with autologous CFSE-labeled T cells for 3 days with or without 500 μM IDO inhibitor 1-MT. CD8+ and CD4+ T-cell proliferation was evaluated by CFSE dilution (mean ± SEM, n = 4).

