
Figure 6. Luminol imaging associates with long-term tumor response.
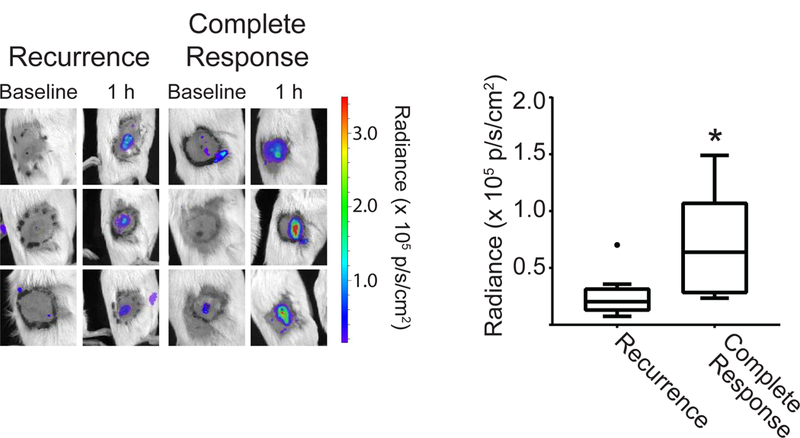
Mice without evidence of tumor recurrence 90 days after treatment (“Complete Response”) had significantly higher luminol signal, taken as the average flux within the 1.1 cm treatment field (black circle), at the 1h post-PDT timepoint. Filled circle in recurrence group indicates outlier. N = 5 for Complete Response and N = 15 for Recurrence. *p = 0.025 for the comparison between mice with a complete response versus recurrence.