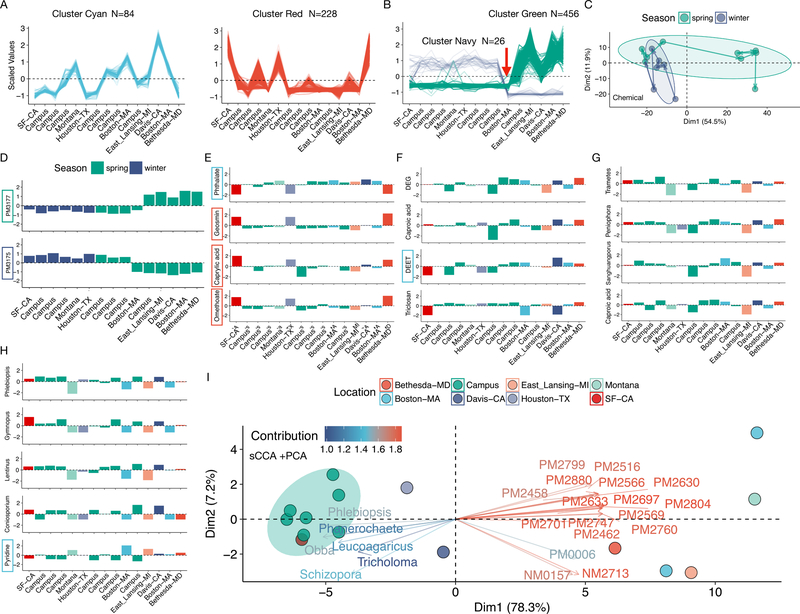
Fig. 5.
The abiotic exposome and its correlation with the biotic exposome. (A) Line plots of the abundance profiles of chemicals of the location-related cluster Cyan (left, N=84) and cluster Red (Right, N=228) as classified by the fuzzy c-means clustering. Each line represents a chemical feature. (B) Line plots of the abundance profiles of chemicals of the putative season-related clusters Green (N = 456) and Navy (N = 26). Transparency of each line (chemical feature) in (A) and (B) corresponds to the membership (>= 0.65). (C) PCA analysis of the abiotic exposome, colored by season. Note that as time progresses a major shift occurs for samples collected in the spring season. (D) Two anti-correlating chemicals potentially corresponding to different seasons. (E) Phthalate (cluster Cyan) is anti-correlated with geosmin, caprylic acid, and omethoate. (F) Several chemicals of interest show unique location-dependent patterns. (G) A chemical feature is positively correlated with several fungal species. (H) Pyridine, an organic solvent, is anti-correlated with multiple fungal species in a location-dependent manner. Colored boxes around chemicals denote their respective clusters. (I) PCA bi-plot of the sCCA-selected biotic and abiotic features. Samples collected from the “Campus” location are tightly clustered. Colored arrows denote the relative importance of contributing features. All correlations have Adj. p < 0.05.

