
Fig. 7.
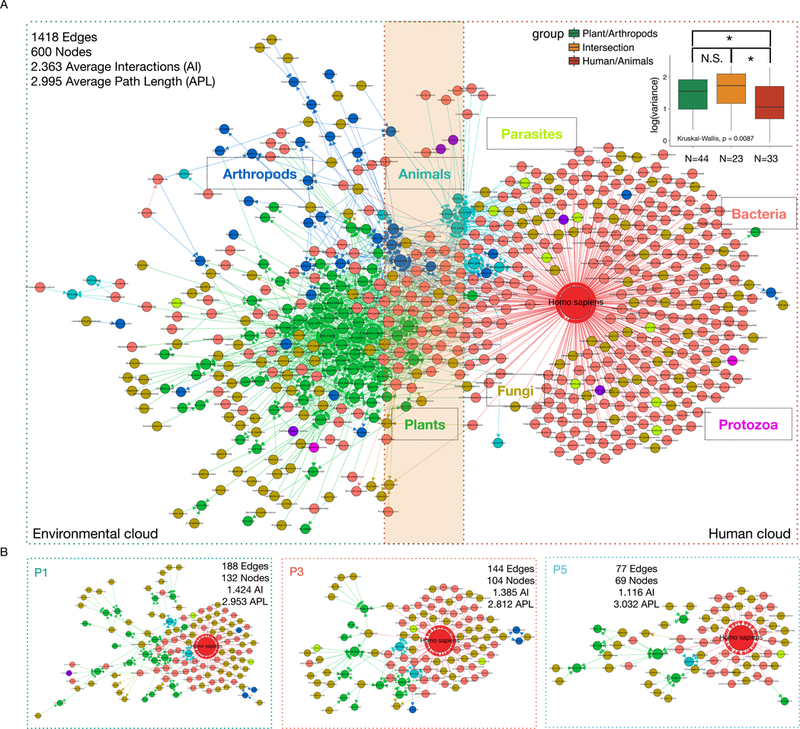
The bi-modal exposome interacting cloud. (A) The interaction network includes a plant-centric environmental cloud and a human-centric cloud. The intersection region between the two clouds is labeled by the dark yellow shade. The inset boxplots show that the species (detected in >= 50 samples) belonging to the Human/Animal group (human cloud) have significant less variance when compared to either Plant/Arthropods group (environmental cloud) or the Intersection group. Y-axis, log value of the variances of the aCPM values of analyzed individual species across all samples. (B) The individual exposome cloud of P1, P3, and P5 show diversity/complexity corresponding to their activity level. The number of average interactions (AI) is calculated at per node basis. The average path length (APL) is calculated by averaging the length of paths connecting any two nodes in the network. The Adj. p values are indicated as: N.S. Not Significant, * <0.05, ** < 0.01, *** < 0.001, and **** < 0.0001.