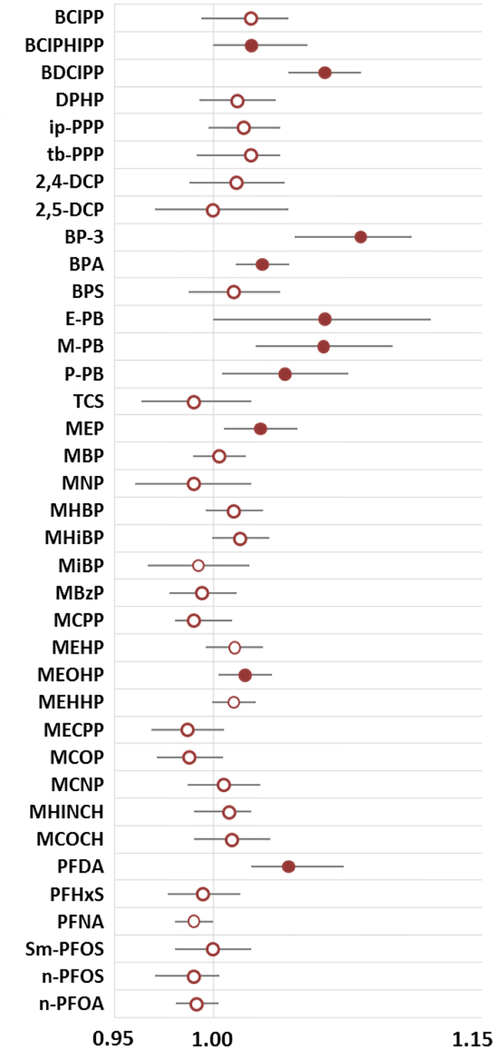
Figure 4:
Estimated multiplicative change in biomarker concentration for a one degree Celsius in average high temperature during the sample collection period. All analyses adjusted for child age and sex and for maternal race/ethnicity and education. Filled circles are used where p<0.05 and bars indicate 95% confidence intervals.

