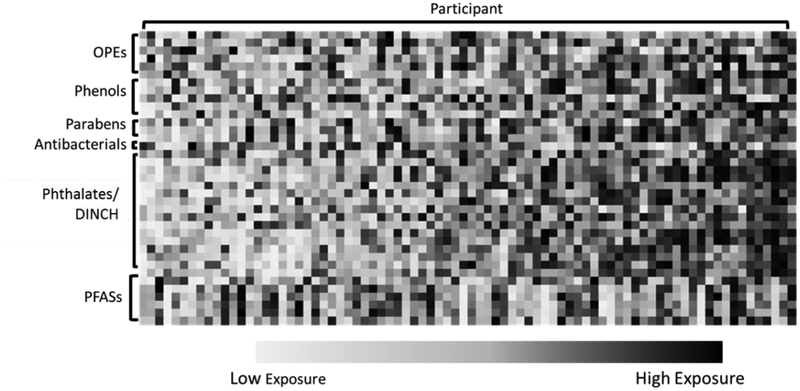
Figure 6:
Biomarker ranking relative to the cohort average for the 80 TESIE participants with both serum and urinary biomarker measurements. Each column depicts rankings for single a participant and each row depicts one biomarker. Blue colors indicate below average concentrations and pink indicates above average concentrations.

