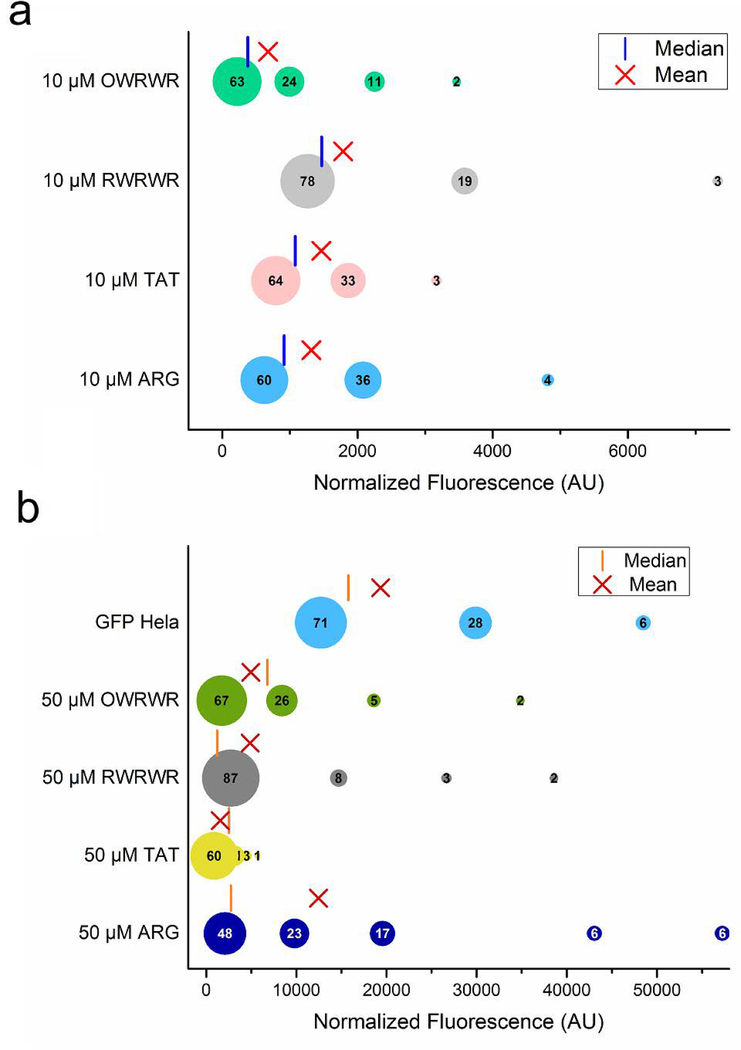
Fig 4.
Distribution and quantification of distinct subpopulation of cells based on CPP uptake. (a) The normalized fluorescence signals of intact HeLa cells incubated with 10 μM peptide solutions quantified by fluorescent microscopy and clustered into 3–5 subpopulations. The number inside each bubble corresponds to the relative size of the cluster for each subpopulation. The mean (red ‘X’) and median (red vertical line) of the entire population is shown for comparison. (b) A similar quantification and clustering as shown in (A) but for HeLa cells incubated with 50 μM peptide solution.

