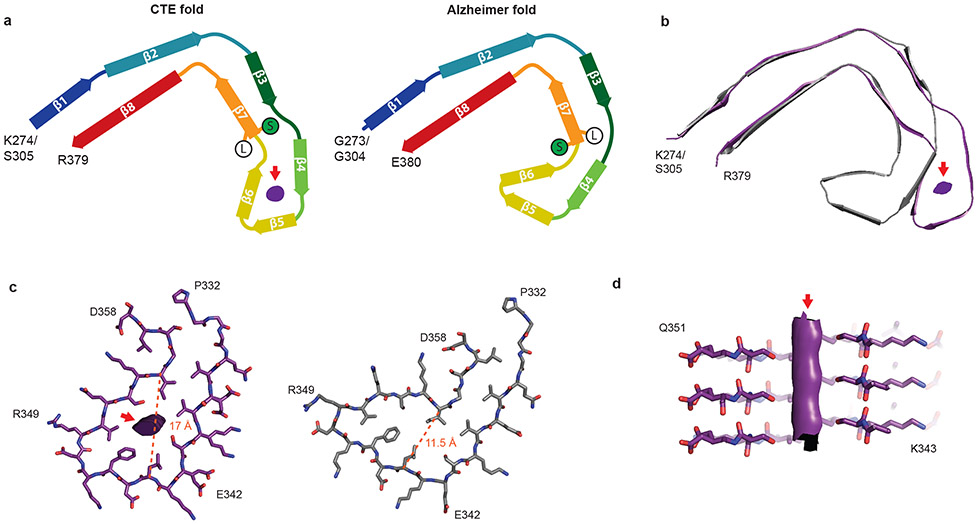
Figure 3: Comparison of the CTE and Alzheimer tau filament folds.
a, Schematic of the secondary structure elements in the CTE and Alzheimer folds, depicted as a single rung. The positions of S356 (green ‘S’) and L357 (white ‘L’) in the two folds are highlighted. The extra density is depicted in grey. b, Overlay of the CTE fold (purple) and the Alzheimer fold (grey), shown as a single rung. c, The β-helices of the Alzheimer fold (grey) and the CTE fold (purple), depicted as a single rung. The distances between the Cα atoms of L344 and I354 are shown as orange dashed lines. d, View normal to the helical axis of the CTE fold β-helix, depicted as three rungs and shown as a cross-section through S341 and S352.

