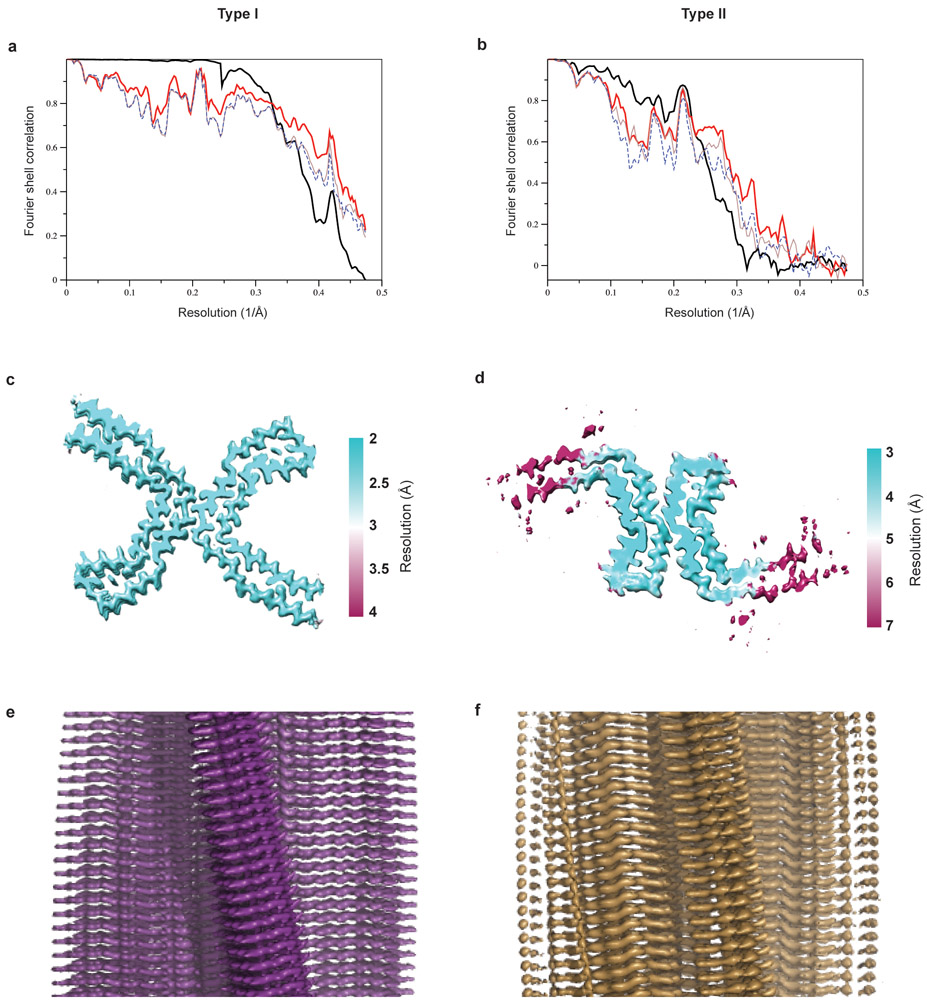
Extended Data Figure 4: Cryo-EM map and model comparisons.
a,b, Fourier shell correlation curves between two independently refined half-maps (bold black line); between the final cryo-EM reconstruction and refined atomic model (bold red line); between the first half-map and the atomic model refined against the first half map (brown line); and between the second half map and the atomic model refined against the first half map (blue dashed line) for CTE type I (a) and type II (b) filaments. c,d, Local resolution estimates for the CTE type I (c) and type II (d) filament reconstructions. e,f, Views normal to the helical axis of the CTE type I (e) and type II (f) filament reconstructions.

