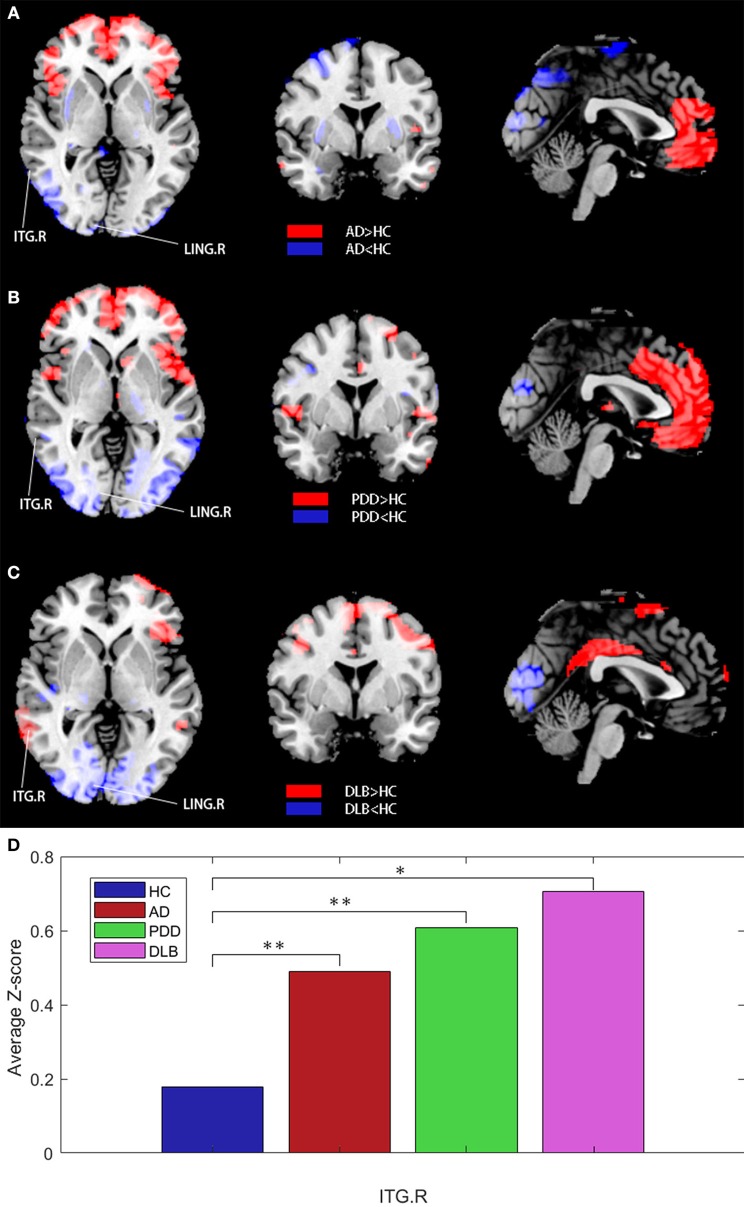
Figure 5.
(A–C) Z-statistics map showing the brain regions with strengthened or weakened connections with the right middle temporal gyrus in patient groups compared with the HC group (FDR corrected P < 0.05). Red, strengthened; blue, weakened. (D) Average Z-scores for the ITG.R in the four groups (*P < 0.05, **P > 0.05).

