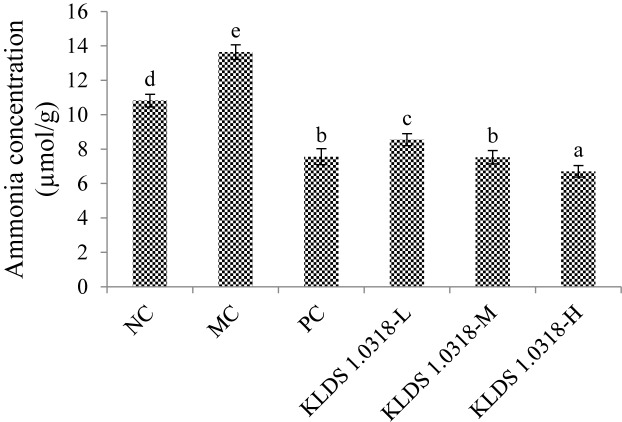
FIGURE 5.
Cumulative production of ammonia in different groups. NC, non-CTX + sterile saline; MC, CTX + sterile saline; PC, CTX + levamisole hydrochloride (40 mg/kg); KLDS1.0318-L, CTX + 5 × 10⁷ CFU/mL L. plantarum KLDS1.0318; KLDS1.0318-M, CTX + 5 × 10⁸ CFU/mL L. plantarum KLDS1.0318; KLDS1.0318-H, CTX + 5 × 10⁹ CFU/mL L. plantarum KLDS1.0318. Data are expressed as the mean ± SD (n = 10). Significant differences (p < 0.05) between the groups are indicated with different letters above the bars.

