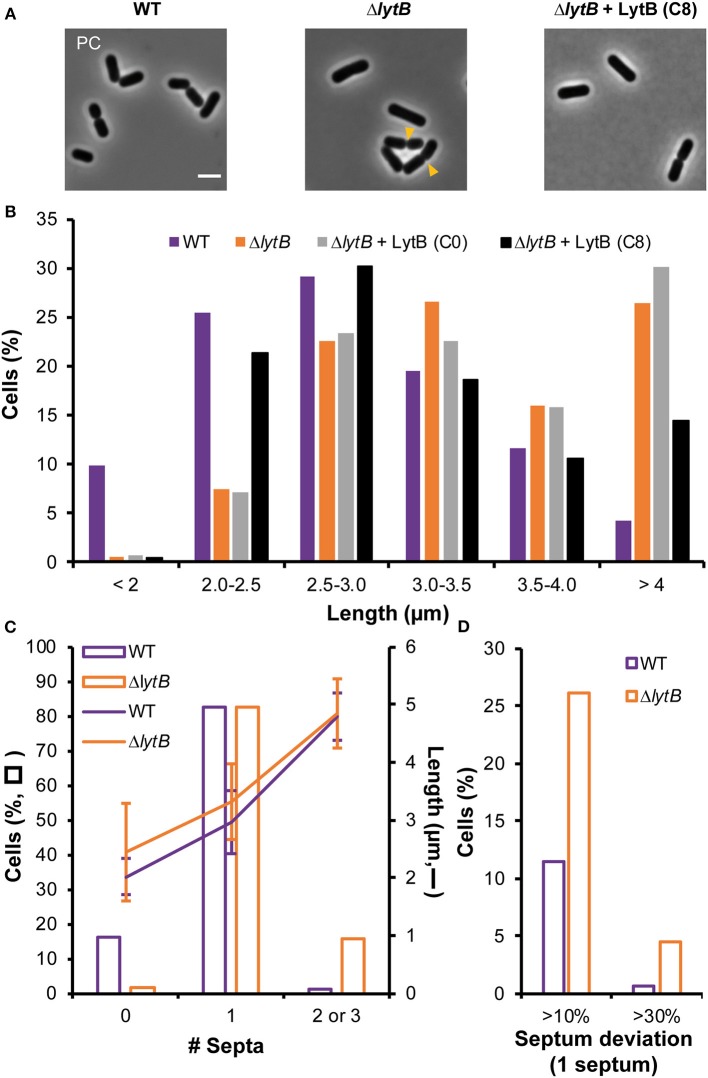
Figure 5.
Effect of LytB deficiency and its complementation on cell morphology and division site positioning. (A) Images of cells of WT, ΔlytB mutant, and ΔlytB mutant complemented with LytB (Pshp0064-lytB; + LytB) obtained by phase contrast (PC) microscopy. Yellow arrowheads show asymmetrical divisions in ΔlytB mutant cells. Bacteria were grown in MRS with erythromycin and ComS (8 μM, C8) when needed. Scale bar is 2 μm. (B) Cell length (μm) of WT, ΔlytB mutant and ΔlytB mutant + LytB without (C0) and with ComS (C8) measured in exponential growth phase. Cells were cultured in MRS with erythromycin and ComS when needed. (C) Number of septa (0 to 3; bars) related to cell length (lanes; mean values ± standard deviations) in WT and ΔlytB mutant cells. (D) Relative septum deviation (% of deviation from the median position of cells stained with FM4-64) in mono-septal cells of WT and ΔlytB mutant. For (B–D) measures were obtained from triplicates by using MicrobeJ with n > 500 cells.

