Figure 7.
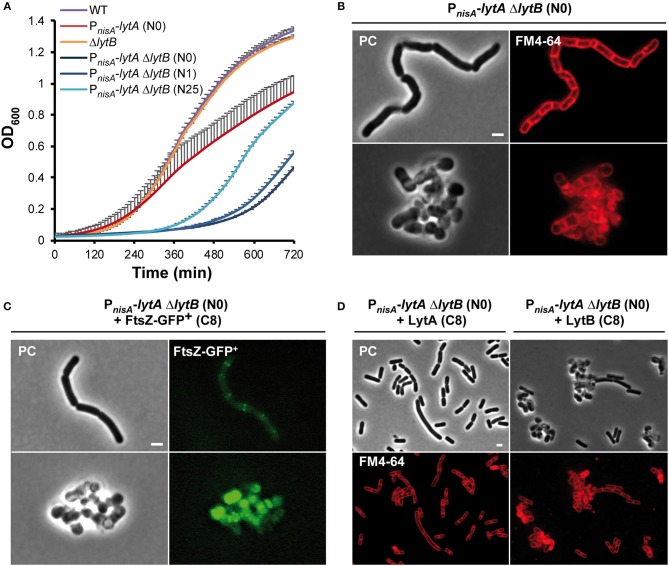
Effect of the double LytA LytB deficiency on growth and cell morphology. (A) Growth curves of WT, PnisA-lytA mutant, ΔlytB mutant and double PnisA-lytA ΔlytB mutant. N0, non-induced; N1 and N25, nisin 1 and 25 ng ml−1, respectively. Bacteria were grown in MRS with chloramphenicol and nisin when appropriate. Curves were generated from triplicates (mean values + standard deviations). (B) Cells of the double PnisA-lytA ΔlytB mutant observed by phase contrast (PC) microscopy and FM4-64 staining under nisin depletion (2 h). Cells were collected from MRS cultures (with chloramphenicol) and observed on agarose pads after suspension in PBS. The scale bar is 2 μm. (C) PnisA-lytA ΔlytB mutant cells expressing FtsZ-GFP+ (Pshp0064-ftsZ-fgp+; + FtsZ-GFP+) observed by epifluorescence microscopy. Bacteria were cultured in MRS with erythromycin and chloramphenicol, and induced with ComS (8 μM, C8) in absence of nisin (N0). Cultures were moderately shaken after induction. The scale bar is 2 μm. (D) Cells of PnisA-lytA ΔlytB mutant complemented with LytA (Pshp0064-lytA; + LytA, left panels) and LytB (Pshp0064-lytB; + LytB, right panels) observed by phase contrast microscopy and FM4-64 staining under nisin depletion (2 h). Bacteria were cultured in MRS with erythromycin and chloramphenicol, and induced with ComS (8 μM, C8) in absence of nisin. Scale bar is 2 μm. For (B–D) similar observations were obtained from at least three independent experiments.

