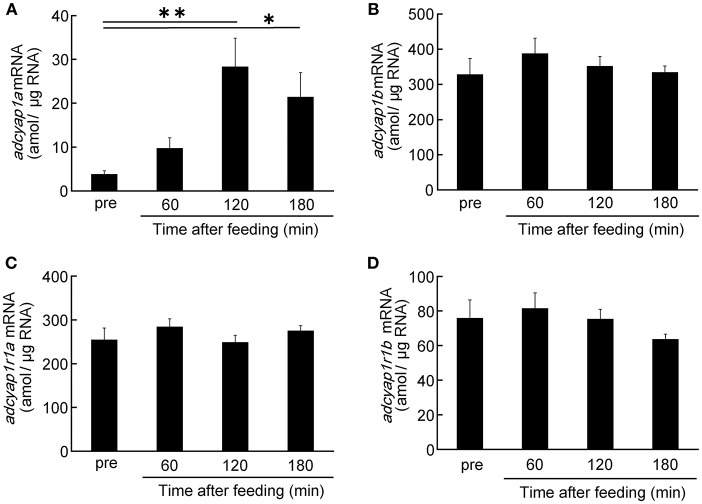
Figure 4.
Time-course changes of PACAP and PAC1R mRNAs level after feeding. Expression levels of PACAP mRNA, adcyap1a (A) and adcyap1b (B) genes, PAC1R mRNA, adcyap1r1a (C) and adcyap1r1b (D) genes were determined using absolute quantitative real-time PCR. The number of samples in the pre, 60, 120, and 180 min groups were 13, 15, 15, and 10, respectively. *P < 0.05, **P < 0.01.

