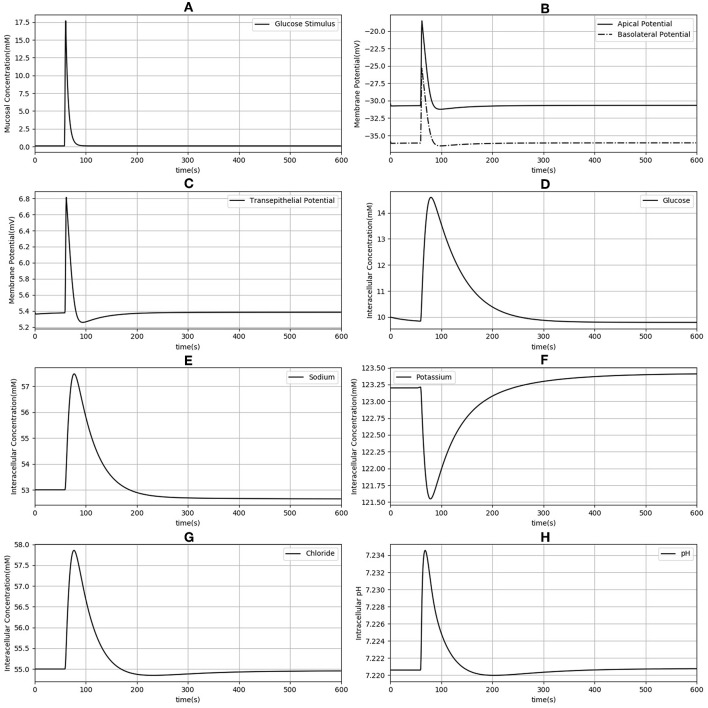
Figure 3.
Dynamic response of the model to an extracellular glucose stimulus. The stimulus consists of a step increase followed by an exponential decay (A). Apical and basolateral membrane potentials (B), transepithelial potential (C), and intracellular concentrations of glucose (D), sodium (E), potassium (F), chloride (G), and pH (H) are shown.

