Figure 6.
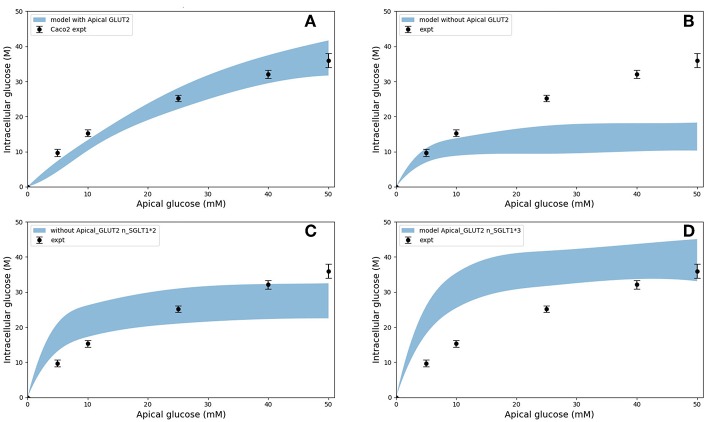
Intracellular glucose concentration vs. extracellular glucose concentration in Caco2 in the presence/absence of Apical GLUT2 with different number of SGLT1 transporter (A) Output of model with apical GLUT2 (B) Model does not have apical GLUT2 (C) model does not have apical GLUT2 and the number of SGLT1 is doubled (D) model does not have apical GLUT2 and the number of SGLT1 is 3-fold higher. Experimental data points and error bars were digitally extracted from Zheng et al. (2012). Strips for the model predictions represent the range of values generated by setting Vb = mVc, m = 0.1, 1, 10, 100, ∞.

