
Figure 7.
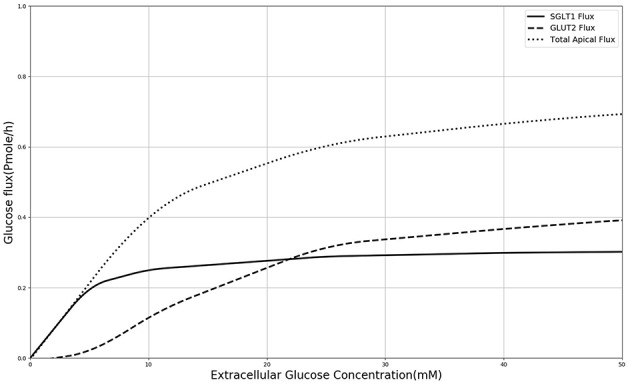
Glucose Flux through SGLT1 and GLUT2 in 600 s of simulation along with total apical flux of glucose.
Official websites use .gov
A
.gov website belongs to an official
government organization in the United States.
Secure .gov websites use HTTPS
A lock (
) or https:// means you've safely
connected to the .gov website. Share sensitive
information only on official, secure websites.
Glucose Flux through SGLT1 and GLUT2 in 600 s of simulation along with total apical flux of glucose.