FIGURE 3.

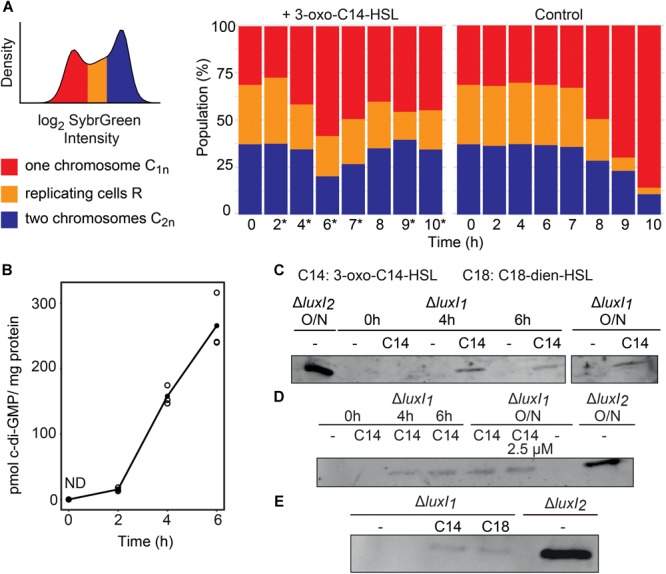
Changes in physiological traits expressed by D. shibae ΔluxI1 in response to external AHL addition. (A) Flow cytometrical determination of the chromosome content by measuring fluorescence intensities of SybrGreen stained cells. The distribution of log2 SybrGreen intensity in the cells (A, left side) shows two peaks C1n (red) and C2n (blue) that represent one and two chromosome equivalents, respectively. Cells undergoing replication (yellow) are located in between. The distribution of the relative chromosome content in the population until 10 h post-induction is displayed for cultures induced by 3-oxo C14 HSL and the control cultures (A, right side). Asterisks indicate significant differences in the proportion of replicating cells between AHL and DMSO treated samples determined with a two-sided t-test. The experiment has been reproduced four times with three replicates each (Supplementary Figures S7–S10). (B) Second messenger c-di-GMP concentration post-induction with 500 nM 3-oxo C14 HSL. Concentrations in pmol c-di-GMP per mg protein were determined for 6 h post-induction by HPLC. ND, not detectable. (C–E) Western blot detection of the GTA major capsid protein in cell extracts of ΔluxI1 induced with 3-oxo C14 (C14) or C18 dien HSL (C18) or non-induced as indicated. (C) Cell extracts at 0, 4, 6 h post-induction and after overnight (O/N) cultivation with 3-oxo C14 HSL and of ΔluxI2 as positive control. (D) Major capsid detection in cell extracts of cultures induced with 500 nM or 2.5 μM AHL and incubated overnight. (E) Induction with 3-oxo C14 or C18 dien HSL.
