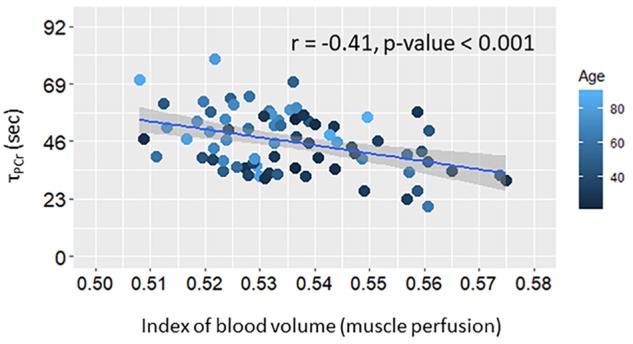
FIGURE 2.

Scatter plot of post-exercise recovery time of phosphocreatine (τPCr) versus muscle perfusion at rest. Linear regression line and summary statistic (Pearson’s correlation and p-value) are shown. Color gradient specifies the age of each single plotted participant.
