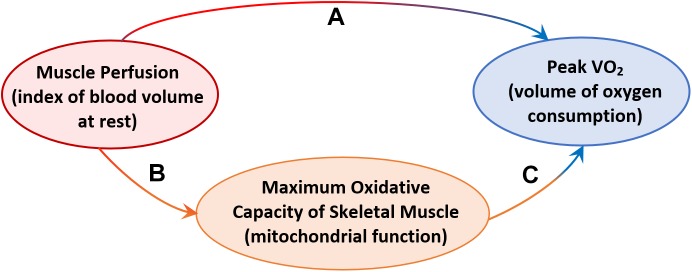
FIGURE 4.
Diagram illustrating: (A) the demonstrated effect of resting muscle perfusion on whole-body aerobic capacity (Peak VO2), (B) the effect of resting muscle perfusion on muscle oxidative capacity measured as post-exercise recovery time of phosphocreatine (τPCr), (C) the effect of resting muscle perfusion on Peak VO2, mediated by τPCr.

