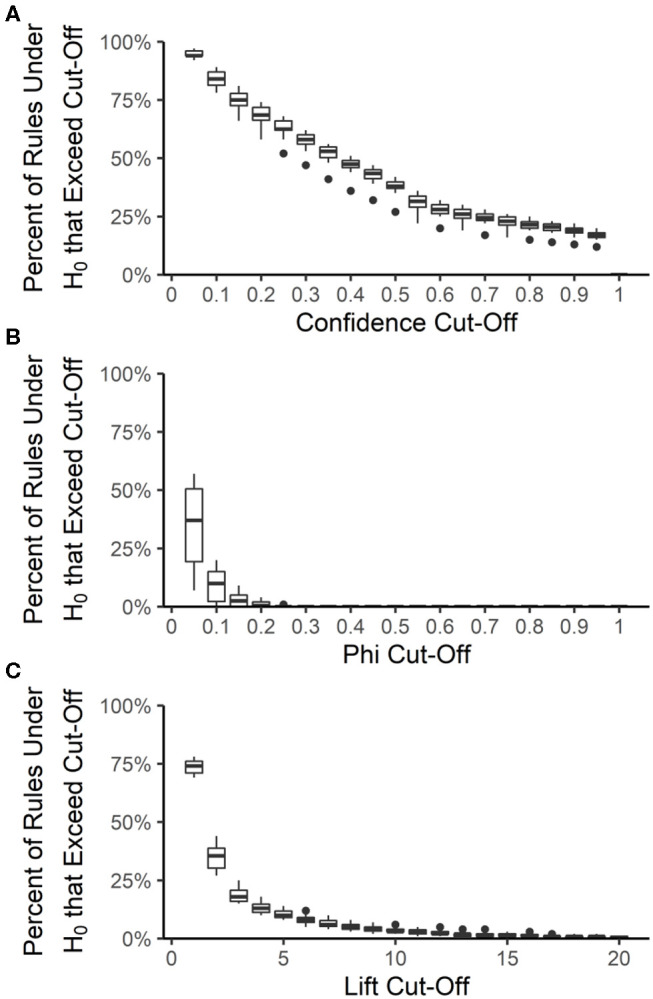
Figure 6.

Distribution of association rule quality measures under the null hypothesis (H0) of no associations. The percent of rules under the null hypothesis (H0) that exceed a given quality measure cut-off was calculated for each year-source dataset and at 20 different cut-off values for confidence (A), phi (B), and lift (C). Boxes are the interquartile ranges among the year-source datasets; solid line is the median, whiskers extend up to 1.5 times the interquartile range and any outliers are marked with points.
