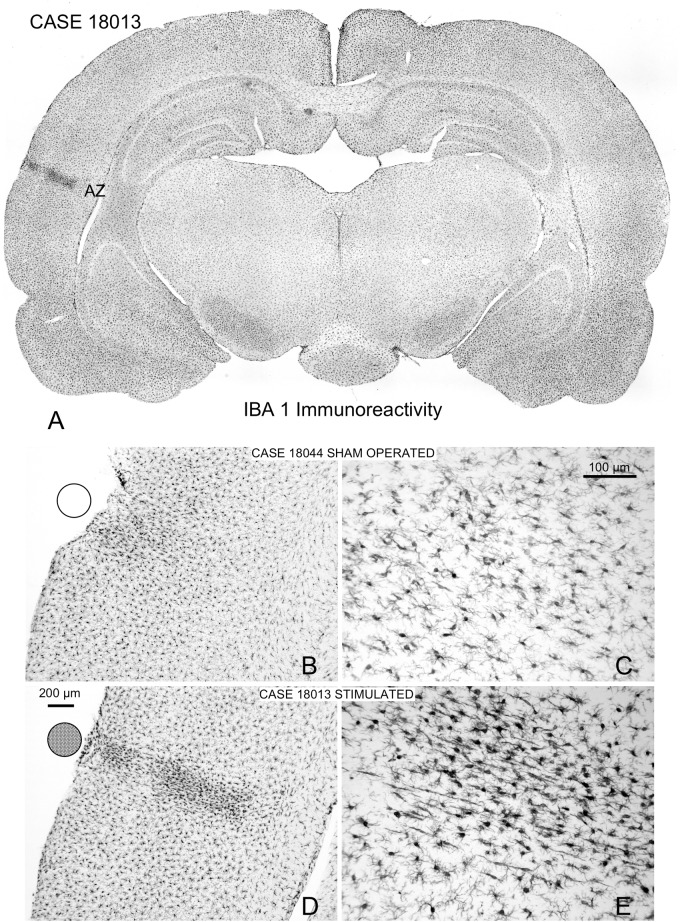
FIGURE 11.
Iba1-immunostained coronal sections. (A) Panoramic view of a multisession stimulated animal. Microglial reactivity is shown in the contact area of the electrode (indicated by circles on the surface), which defines the AZ similarly to GFAP immunoreactivity (please compare with Figure 6). (B,C) Sham-operated control with a small area devoid of labeling shown in the contact area of the electrode. (D,E) Coronal section of a multisession-stimulated animal with positive, reactive microglial cells in the AZ distributed across layers and oriented parallel to the perforant vessel.

