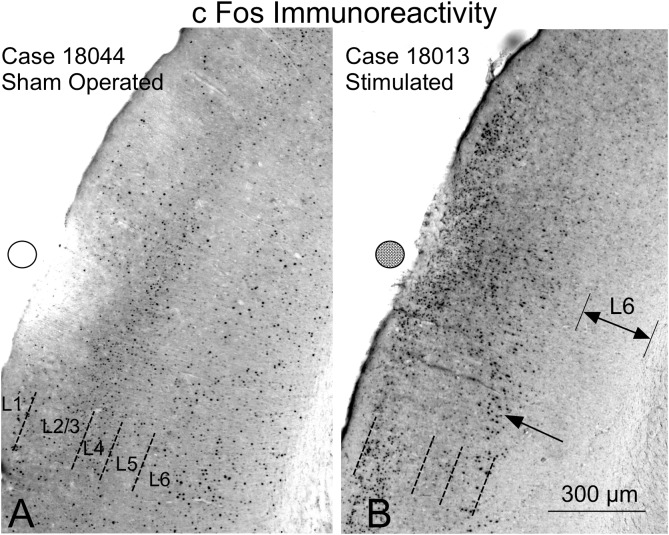
FIGURE 12.
c-Fos immunoreactivity in the AC. Circles (empty – inactive, solid – active) represent the estimated position of the electrodes. The cytoarchitectural distribution of immunoreactive neurons sham-operated neurons (A) is different from that of multisession-stimulated neurons (B). (A) In sham-operated controls, a small area devoid of labeling is shown in the contact area of the electrode, and positive neurons are distributed across well-defined layers. (B) Stimulated animals show an increase in immunoreactive neurons in the superficial area and loss of immunoreactivity in layer 6 (L6).

