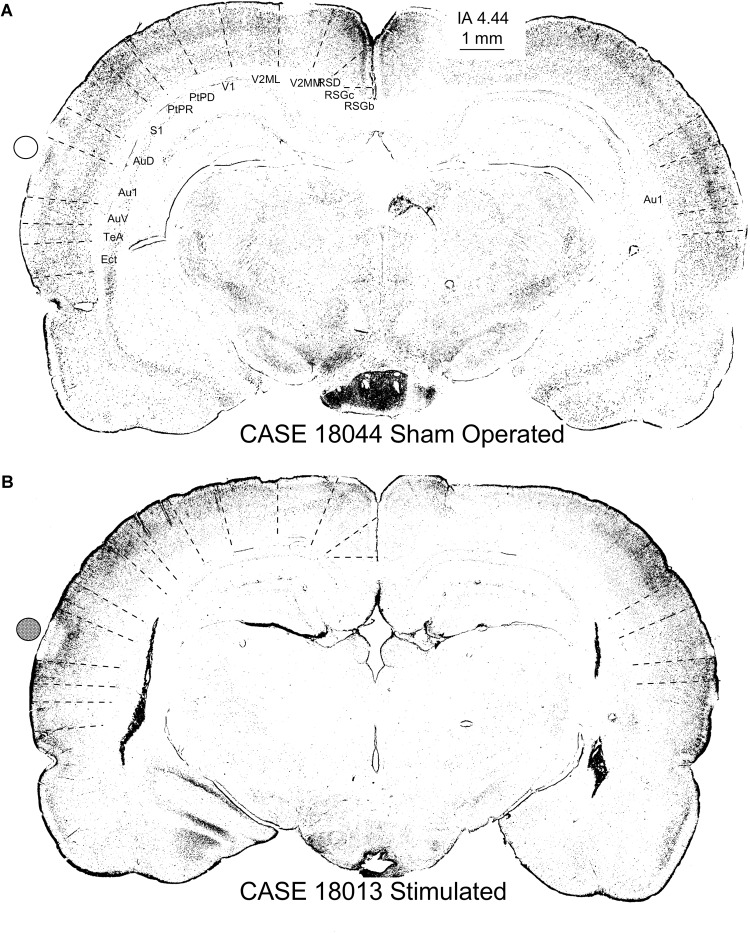
FIGURE 13.
c-Fos-immunostained coronal sections of a sham-operated control (A) and multisession-stimulated animal (B) after densitometrical segmentation and map representation using the ImageJ binary mask plugin. In these figures, each dot is a c-Fos-immunopositive neuron. Sham-operated control animals in (A) allow us to differentiate cortical layers and the cytoarchitectural subdivision (dotted lines show superimposed and scaled Paxinos atlas cytoarchitectural subdivisions). Coronal section from a stimulated animal (B) shows an area devoid of labeling matching the area of contact of the electrode (active electrode position is represented by a solid circle), as well as an increase of immunopositive neurons in the supragranular layers and a decrease in layer 6. Note that cytoarchitectural subdivisions clearly delimited by differences in the distribution of c-Fos immunoreactive neurons (see the contralateral ACs in the sham control) in (A) are more difficult to differentiate in (B). Furthermore, also note the loss of canonical organization in layers of the brain cortex, as shown in maps (B), compared with the sham control (A).

