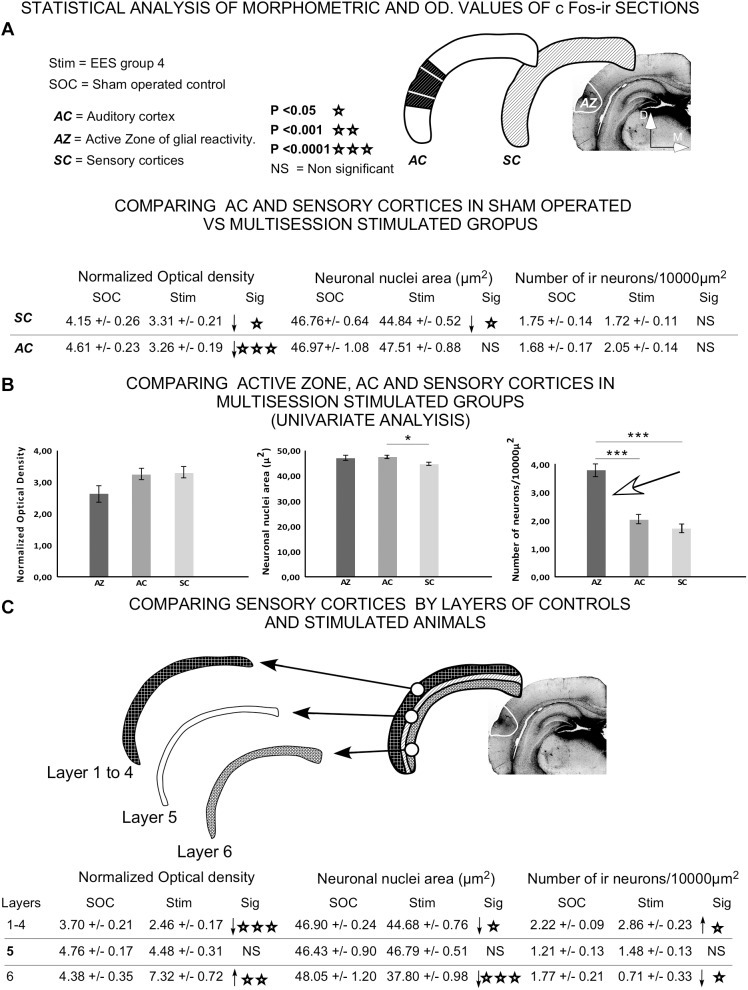
FIGURE 14.
Statistical analysis of morphometrical and optical density (OD) values of c-Fos-immunoreactive neuronal nuclei. Insets represent the areas analyzed for comparison. (A) Statistical analysis was performed to assess significant differences in data when comparing AC or all sensory cortices (SC) between sham controls and group 4. (B) Univariate analysis of data between cortical areas (AZ, AC, and SC) in epidural-stimulated experimental group 4. (C) Differences between sham-operated group 2 and EES group 4 by layer of sensory cortices. Student t-test was used to compare experimental groups in (A,C), and univariate general linear model was applied in (B). Statistical significance was set at p < 0.05.

