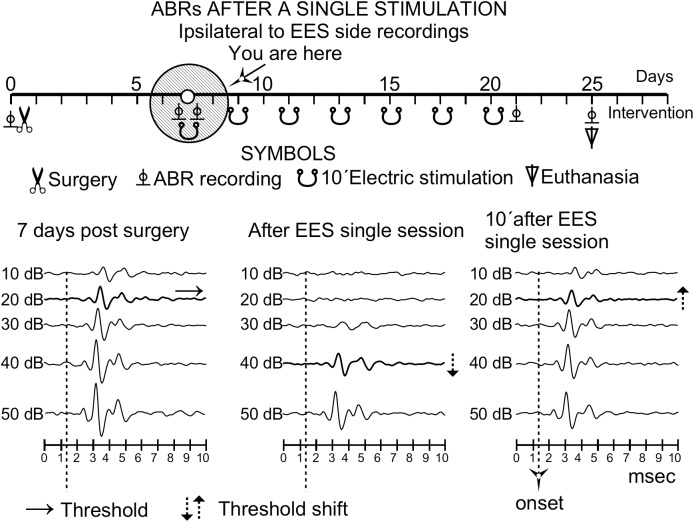
FIGURE 3.
Timeline effect of a single stimulation analyzed by ABR after the first stimulus of a multisession protocol in an animal of group 3 (ipsilateral ear to EES). The time course representation is similar to that of Figure 1. Solid circles indicate the time of the recordings 7 days after surgery. Note that the 20-dB threshold shift (middle) recovers (right) 10 min after the stimulation session. Changes in threshold are indicated by doted arrows.

