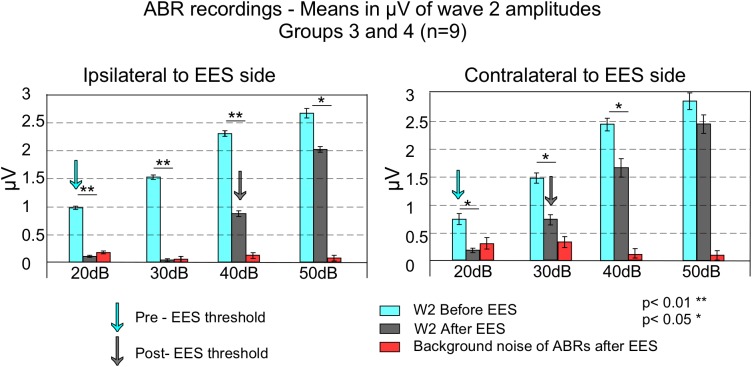
FIGURE 4.
This figure shows averaged wave 2 peak to peak amplitudes and standard error of the means (error bars) of ABR of the sides ipsilateral (left) and contralateral (right) to EES, in groups 3 and 4 (n = 9). Blue bars represent average wave amplitude before EES and gray bars after EES. Red bars indicate background noise after EES. Before EES, ABR thresholds were established at 20 dB for both side recordings (blue arrows). Background noise to signal comparison (by comparing red and gray bars) allows to determine ABR thresholds at 40 dB in the ipsilateral side and 30 dB in the contralateral (gray arrows). EES caused stronger decreases in wave 2 amplitude in the ipsilateral side compared to the contralateral.

