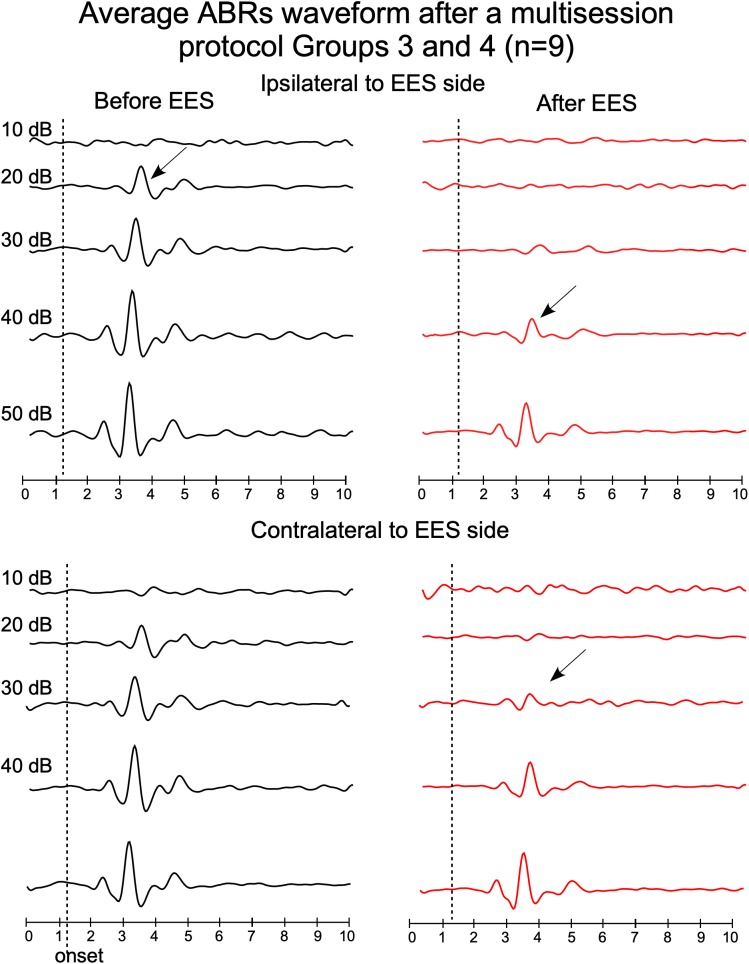
FIGURE 5.
Average waveforms of ABRs from groups 3 and 4, recorded before (left) and after (right) multisession stimulation protocol (top panels: ipsilateral ABR and bottom panels: contralateral ABR, respect to the EES side). Timelines of protocol of groups 3 and 4 are shown in Figure 1. Arrows indicate average thresholds determined as indicated in Figure 4.

