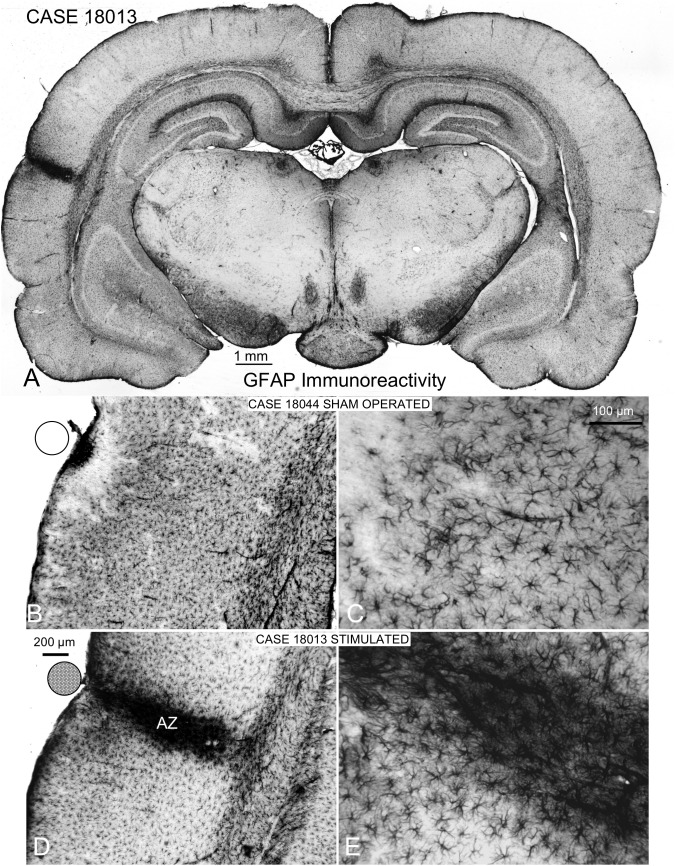
FIGURE 7.
GFAP immunocytochemistry of coronal sections of multisession-stimulated and sham-operated rat brains. (A) Panoramic view of a case of the multisession protocol group, which shows a restricted cortical intramural increase in immunoreactivity where the stimulation electrode is located (on the AC). (B,C) Sham-operated control showing a small, dense immunoreactive area in the surface and a restricted, superficial band devoid of labeling. (D,E) Active zone (AZ) of electric stimulation. Note the intense staining of astrocytes and blood vessels inside AZ.

