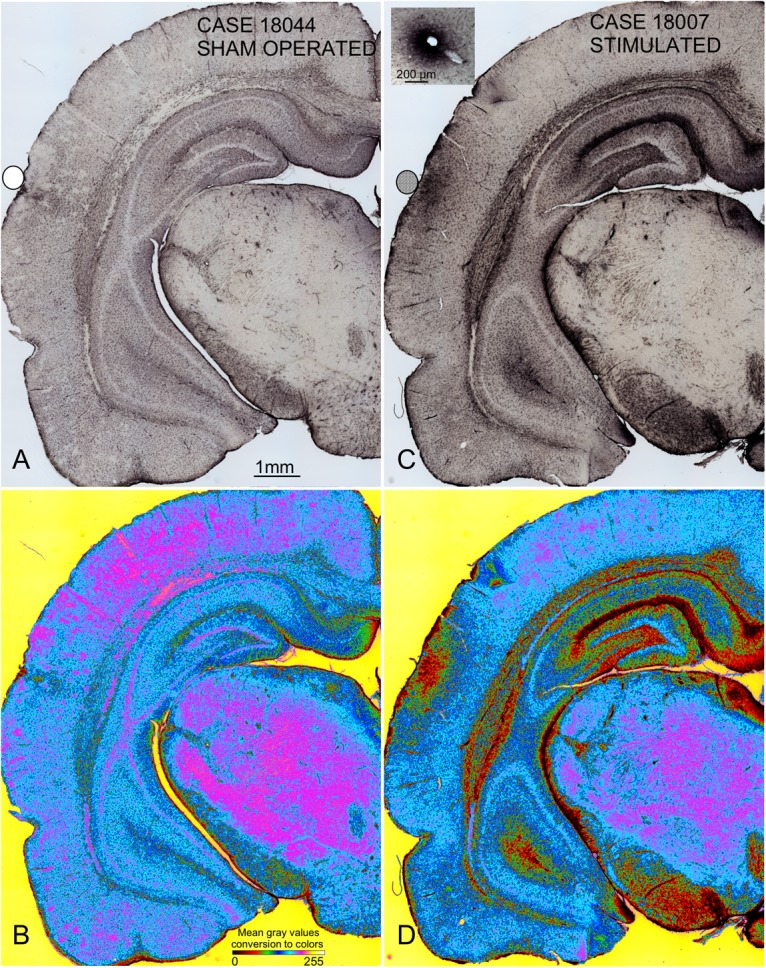
FIGURE 8.

Panoramic GFAP-immunostained coronal sections from sham-operated (A,B) and multisession-stimulated (C,D) rat brains showing global changes in immunoreactivity only after multisession stimulation. To better visualize differences in immunoreactivity, pseudocolor-converted images (ImageJ, six shades plug-in) are shown in (B,D). Codification and calibration of gray densities by color are shown in the bottom section of (B). Blacks and reds match the densest immunoreactivity areas. For this analysis, digital microphotographs were taken under the same microscope illumination conditions and without subsequent manipulation. The densest immunoreactive areas found in the auditory cortex match the area of electric current injection (AZ), in the white matter and in areas of contact with the cerebrospinal fluid. The inset in (C) shows dense interstitial immunoreactivity around a blood vessel.
